Climate change is to blame, but targeted and poorly executed planning decisions mean that half of U.S. buildings lie in natural hazard “hot spots.”
By Meghan Zulian, University of California, Davis, Temblor science writing extern (@MeghanZulian)
Citation: Zulian, M., 2022, Most Americans live in natural hazard hot spots, Temblor, http://doi.org/10.32858/temblor.229

On a crisp December morning on the outskirts of a Sonoma County town, the sun slowly rises over dewy, green, rolling California hills. A semisweet aroma of burning wood wafts through the air, pricking my senses.
Panic strikes.
A chimney vents in the distance.
Relief floods through me. Even if it were a fire, the latest atmospheric river seems to be keeping conditions manageable.
The sound of construction clink and jangle nearby as more houses seem to rise from the ashes of past wildfires. People need somewhere to live, in spite of the hazards. I consider that this might be a bad idea, but where else would they go?
These thoughts exhaust me, and likely tire other Sonoma County residents trying to rebuild their lives after devastating wildfires wrought destruction. Along the West Coast, extreme precipitation patterns and hot, dry temperatures continue to crisp landscapes, fueling record-breaking wildfires and extreme drought. However, the East and Gulf coasts bear their own burdens as hurricanes increasingly suck up more energy and water from warming oceans, intensify more rapidly, and deluge communities with ever-stronger and more unpredictable winds and rain. Meanwhile, the Midwest and Plains has seen more flooding as well as droughts, and more extreme temperature swings and storms, like tornadoes.
A changing climate exposes more humans to natural disasters with each passing decade. According to a recent study in Earth’s Future, more than half of all structures in the U.S. are in natural hazard “hot spots” — areas where hazards are either highly likely to strike, or would strike with great intensity (Iglesias et al., 2021). Some 1.5 million of those structures sit within two or more hot spots, meaning that these structures risk damage or destruction from multiple menaces. Yet, the study also notes that these numbers are higher than expected from climate change alone.
The analysis of hazard data and settlement patterns from recent decades reveals that development in hot spots outpaced growth elsewhere. In other words, the number of people who live and work in hazard hot spots is soaring. Zoning and planning laws and commissions put more people in harm’s way by refusing to limit development in these hazardous zones. Much like with environmental pollution (RD Bullard, 1994), low income and communities of color face higher exposure and risk from hazards, with less resources for recovery.
When people spend more time in hot spots, their exposure to natural hazards and the likelihood of negative outcomes increase, the study explains. Hot spots also contain municipal water supplies, hospitals and entities responsible for emergency management (e.g., airports, fire departments.). The clustering of this critical infrastructure has serious consequences when disaster strikes.
Hazard hot spots
For the new study, Virginia Iglesias of the Cooperative Institute for Research in Environmental Sciences at the University of Colorado, Boulder, and her colleagues, identified natural hazard hot spots by integrating data from the U.S. Geological Survey National Seismic Hazard Model, the U.S. Forest Service Wildfire Hazard Potential (WHP) Model, the National Hurricane Center Extended Best Track Database, and the National Oceanic and Atmospheric Administration’s (NOAA) Weather Service documentation of historical tornado pathways. They also incorporated river flood data from Fathom.
Each database has unique units, as well as temporal and spatial scales, which presents challenges when comparing how the densification and expansion of infrastructure drive escalating exposure to each hazard. For example, earthquakes have units of ground acceleration, and when they strike, they shake entire regions for seconds or minutes. On the other hand, wildfires have units of hectares burned, and affect isolated areas for weeks. Researchers dealt with these dissimilarities by resampling all data to the same spatial resolution (250-meter by 250-meter squares) while maintaining unique units and timescales.
If either the probability or intensity of a hazard in any square was in the top 10 percent compared to all other squares, the researchers labeled it as part of a hazard hot spot. This method caught sites of historical disasters, such as the 1906 San Francisco earthquake and 1900 Galveston hurricane, demonstrating the study’s ability to effectively capture hot spots.
Expansion vs. densification
The researchers added a new component to hot spot identification: They pulled data from Zillow, the prodigious online real estate marketplace, to see whether patterns of infrastructure development put more people in harm’s way.
Development drives human exposure to natural hazards through one of two mechanisms — expansion onto formerly undeveloped lands or densification in urban areas (Leyk, Uhl and Connor, 2020). To detect expansion and densification, the researchers analyzed data from Zillow’s Transaction and Assessment Database (ZTRAX) — home to 370 million housing and property records from recent decades. Like with the hazard maps, the researchers resampled building and property data at 250-meter by 250-meter resolution and averaged the data in five-year intervals between 1945 and 2015. If a square’s property or building data changed from undeveloped land to residential, it experienced expansion. If a square’s property or building data changed from single-family residential to multifamily, it experienced densification.
By overlaying hazard and settlement maps and analyzing changes in property data through time, the researchers could see how expansion and densification increased human exposure to each hazard.
Density, demographics and development
The researchers found that, despite climate change increasing the intensity of hurricanes, dense building development in urban areas prior to 1960 drove most of the increasing exposure to two types of hazards: hurricanes and earthquakes. This densification was also accompanied by rapid suburban growth, which is intrinsically linked to expansion through socioeconomic factors.
For example, following the desegregation of America’s military in 1948, and Brown vs. Board of Education, Black Southerners sought better opportunities in the North and on the West Coast. Cities like Philadelphia, New York, Los Angeles, and Oakland became even more densely populated. In response to the influx of Black residents into cities (densification), white people left for the suburbs in droves (expansion). Of course, Philadelphia and New York are hurricane hot spots, and Los Angeles and Oakland are prone to earthquakes.
The Federal Housing Agency accommodated the influx, and coupled exodus, by persuading planning commissions in cities like Los Angeles to adjust their zoning requirements to favor suburban development and homeownership. At the same time, the Home Owners Loan Corporation (HOLC) was prohibiting the granting of loans and imposing higher interest rates on Black and Brown residents seeking homeownership through discriminatory practices known as redlining.
Between HOLC redlining and discriminatory GI bill exemptions, suburban housing was only an option for white veterans who were guaranteed government-backed, low-interest, fixed-rate mortgages. Discriminatory housing and city planning regulations set the stage for disproportionately low rates of Black homeownership that persist today, especially in suburban areas.
Now, decades later, suburban counterparts face less exposure to hurricane and earthquake hazards than urban communities, many of which are low income and communities of color. Also, because disaster management revolves around compensation for home values, and homes in redlined communities are valued less, Black and Brown homeowners are given less assistance during the recovery process.

Additionally, in the wake of hurricanes and earthquakes, white homeowners who benefit from generational wealth obtained through redlining are marching back into “trendy” urban centers that their families once abandoned (Pais and Elliot, 2008). As areas recover, plummeting vacancy rates and skyrocketing housing costs squeeze out renters. When cities “build back better” to assert the disaster is behind them, they leave out former residents — homeowners who can’t rebuild, and renters who can’t afford the updated, upgraded units (Pais and Elliot, 2008).
According to the Earth’s Future study, better city planning, investment patterns and building codes could effectively mitigate damage from a hurricane’s winds or an earthquake’s shaking by ensuring that structures and communities can both withstand and recover from disaster.
Expansion, equity and exposure
For tornado, wildfire and flood exposure over the last few decades, climate change and expansion played the most significant roles in increasing risks.
Iglesias and her team note that burgeoning development adjacent to tornado hot spot cities (like Atlanta) puts socially and structurally vulnerable communities such as mobile home parks at higher risk. Rigorous building codes could potentially mitigate future exposure and damage. However, identifying tornado-prone areas is incredibly difficult, as “Tornado Alley” shifts from Oklahoma to Alabama, Tennessee and other southeastern states. Most recently, a 320-kilometer stretch of tornado damage wiped out Dawson Springs, Ky., where a quarter of the population lives below the poverty line.
The researchers also found that expansion of affordable housing into the wildland-urban interface proceeded at 10 times the national expansion rate. Such intense development created a 10-fold increase in human exposure to wildfire through a wicked feedback loop — more people ignite more fires, exposing more people to fires. Some people are taking it upon themselves to build fire-resistant homes, but such fire-hardened homes are still not the standard.
Beyond fire-proofing and hardening, another solution endorsed by many is to reinstate Indigenous-led controlled burning of invasive, drought-intolerant European grasses that fuel extreme wildfires. Prescribed burns (previously banned through fire suppression laws) and reintroduction of native grasses could curtail the extent and intensity of wildfires by reducing the “fuel source” through the removal of excessive brush, shrubs and trees. Prescribed burns also occur at lower temperatures than wildfires, and benefit the ecosystem by recycling nutrients and promoting the germination of certain native species. By preventing extreme wildfires, this approach would also indirectly mitigate flood and landslide damage, which are more pervasive on extensively burned ground.

As precipitation surges in some places in response to climate change (recent atmospheric rivers along the West Coast, for example), flood damage costs continue to rise and are greater than any other hazard, despite expansion rates falling well below the national average in regions that experience this type of hot spot. Like with fire, engineering solutions exist: levees. Levees are a widely used solution for mitigating flood exposure. Unfortunately, poor planning, policies and communications surrounding levees have serious and unintended consequences.
Sloppy solution execution
Engineers design levees for “100-year flood” events, a misnomer meant to describe the magnitude of floods that have a 1 percent chance of occurring every year. With climate change, some regions are now seeing back-to-back years with “500-year floods,” which are floods that have a half percent chance of occurring every year, or at least they did when these statistics were calculated.
FEMA floodplain management and regulations and corresponding flood insurance program consider homes behind the levees “safe.” This means FEMA tells homeowners that flood insurance isn’t necessary because flooding is so unlikely. City planners and insurance agencies also oversell the protection provided by levees, meaning even fewer homeowners are likely to buy flood insurance. As a result, when the floods devastate homes, people struggle to rebuild, Iglesias and her colleagues point out.
But this issue isn’t restricted to new development in supposedly safe areas.
In Sacramento, homes in historically red- and yellow-lined communities (areas deemed as declining in desirability or hazardous) face a 22 percent risk of flooding compared to 11 percent in blue and green-lined areas (communities deemed best or still desirable).
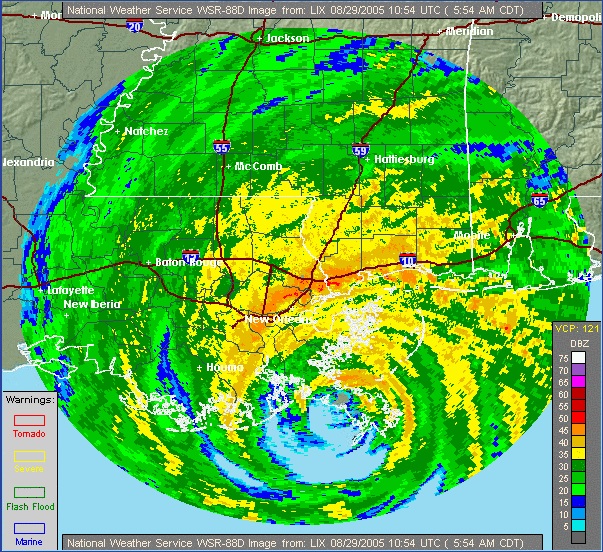
For Samantha Montano, an assistant professor of Emergency Management at the Massachusetts Maritime Academy, the issues resulting from FEMA, insurance companies and failed levees are unsurprising. Montano spent years working with New Orleans nonprofits in the wake of 2005’s Hurricane Katrina. She notes that post-Katrina, many residents of the Lower Ninth Ward of New Orleans had to navigate complex bureaucratic hoops to prove their homeownership so they could collect flood damage relief funds. FEMA only addressed this issue in September 2021 after nearly a decade of lawsuits.
“In New Orleans … there were high rates of Black homeownership and homes had been handed down generation to generation,” Montano explains. “A lot of homeowners [had] a house, but … were still living paycheck to paycheck. Many did not have flood insurance. Some had been told they didn’t need flood insurance because they were behind the levees.”
Also, as FEMA doled out disaster recovery funds through the Road Home program, they chose to compensate based on home value rather than the cost of damages. This resulted in wealthier, whiter neighborhoods receiving more money to repair damages relative to historically redlined neighborhoods where home values still reflect decades of negligence.
Montano says that in the face of disaster and crisis, activism is paramount for any communities that want to be the ones deciding when their hazard risk and exposure are no longer tenable. “When they run out of resources, when they run out of patience, when they run out of the will to kind of keep going through that rebuilding process … that’s their decision,” she says. “It is very important to recognize that communities don’t necessarily get to make that decision on their own.” In particular, she explains, many communities are barred from making those decisions because of inequitable distribution of disaster relief funds.
How do communities ensure good planning, policies and insurance, as well as solutions (i.e., levees)? Montano says policies and city planning need to reflect what we learn in studies like that of Iglesias and colleagues. Such changes only happen when communities apply pressure on city officials and get known risks on public record. “Go to those local community meetings,” says Montano. “Make sure that you are pushing back against those development decisions, or at least asking questions like, ‘How are you going to manage the risk?’”
References
Ashley, W.S. & Strader, S.M. (2016). Recipe for disaster.
Bullard, R. D. (1994). Environmental justice for all.
Collins, T. W., Grineski, S. E., & Chakraborty, J. (2018). Environmental injustice and flood risk: a conceptual model and case comparison of metropolitan Miami and Houston, USA. Regional environmental change, 18(2), 311-323.
Davenport, F. V., Burke, M., & Diffenbaugh, N. S. (2021). Contribution of historical precipitation change to US flood damages. Proceedings of the National Academy of Sciences, 118(4).
Grineski, S. E., Collins, T. W., Ford, P., Fitzgerald, R., Aldouri, R., Velázquez-Angulo, G., … & Lu, D. (2012). Climate change and environmental injustice in a bi-national context. Applied Geography, 33, 25-35.
Iglesias, V., Braswell, A. E., Rossi, M. W., Joseph, M. B., McShane, C., Cattau, M., … & Travis, W. R. (2021). Risky development: Increasing exposure to natural hazards in the United States. Earth’s future, 9(7), e2020EF001795.
Leibbrand, C., Massey, C., Alexander, J. T., Genadek, K. R., & Tolnay, S. (2020). The great migration and residential segregation in American cities during the twentieth century. Social science history, 44(1), 19-55.
Leyk, S., Uhl, J. H., Connor, D. S., Braswell, A. E., Mietkiewicz, N., Balch, J. K., & Gutmann, M. (2020). Two centuries of settlement and urban development in the United States. Science advances, 6(23), eaba2937.
Pais, J. F., & Elliott, J. R. (2008). Places as recovery machines: Vulnerability and neighborhood change after major hurricanes. Social forces, 86(4), 1415-1453.
Sovacool, B. K. (2017). Don’t let disaster recovery perpetuate injustice. Nature, 549(7673), 433-433.
Thacker, S., Barr, S., Pant, R., Hall, J. W., & Alderson, D. (2017). Geographic hotspots of critical national infrastructure. Risk Analysis, 37(12), 2490-2505.
Whittemore, A. H. (2013). How the federal government zoned America: the federal housing administration and zoning. Journal of Urban History, 39(4), 620-642.
- Venezuela’s doublet leaned toward Caracas - June 30, 2026
- Is Southern California’s Cajon Pass an ‘earthquake gate’ ready to open? - June 29, 2026
- Philippines magnitude 7.8 shock may have loaded the central Cotabato subduction zone - June 11, 2026