As climate-related hazards increase in intensity and frequency, communities and insurers can use updated risk maps and models to understand and estimate loss.
By Rebecca Owen, Science Writer, @beccapox
Citation: Owen, R., 2022, Changing climate, changing insurance risk, Temblor, http://doi.org/10.32858/temblor.281

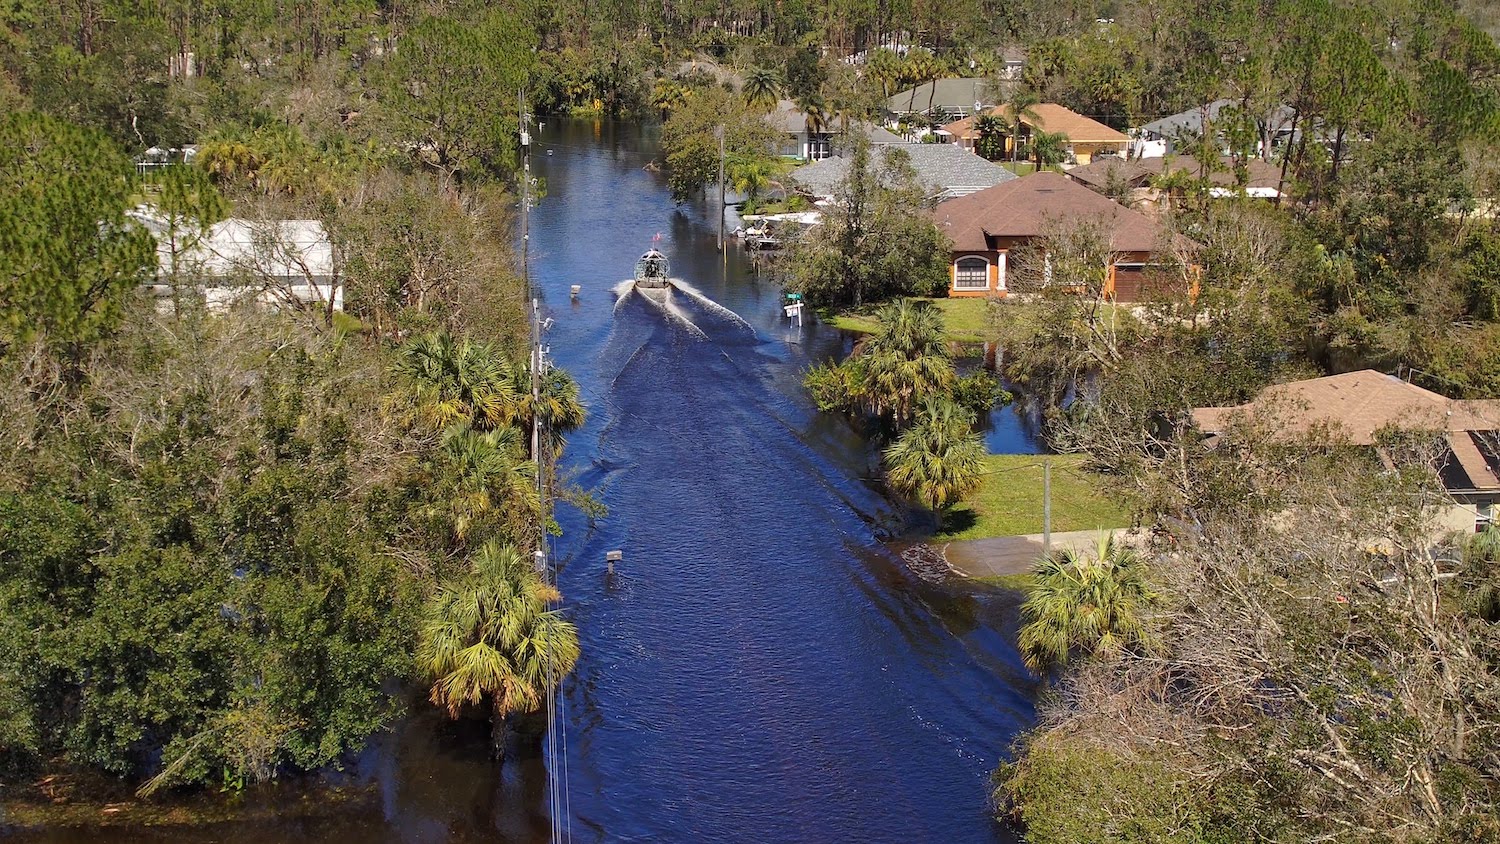
Hurricane Ian hit the Florida coastline with sustained windspeeds of 145 miles per hour. The monstrous category-four storm ripped apart buildings and inundated coastal communities with relentless storm surge. More than a hundred people died during Ian’s ferocious march across Florida and into South Carolina. As the water recedes and storm clean-up continues, residents of hard-hit areas are left with questions of what comes next.
As temperatures and sea level rise due to climate change, larger and more unpredictable hazards will befall vulnerable populations and landscapes. Many burgeoning communities along low-lying coastlines or in the wildland-urban interface face potential damage from frequent natural disasters like hurricanes or wildfire.
The insurers that cover properties in high-risk areas have an incentive to follow the latest climate science as well as to work with communities to develop safer buildings and mitigation efforts to prevent loss of life and property. Catastrophe modeling and mapping provides a tool for insurers as well as municipal leaders and planners to understand how to protect property in disaster-prone regions.
Hurricane Ian is just one particularly deadly example of the many natural catastrophes that occurred in the United States this year. As of October 2022, there have already been fifteen major weather or climate-related disasters, including Hurricane Fiona, as well as tornadoes, heatwaves, extreme drought, flooding and wildfires affecting regions all around the country. Each of these instances this year can be considered a billion-dollar disaster, as destruction lead to soaring costs of displacement, repair and loss in affected communities.
Although there is evidence that the number of hurricanes striking the eastern seaboard may be decreasing, the storms that do materialize are more intense and cause more damage in regions with growing populations and industries. “Hurricane Ian was the sixth major hurricane to make landfall in the Gulf [of Mexico] in the last six years,” says Tom Larsen, senior director of hazard and risk management at CoreLogic, a catastrophe modeling firm. “But all of those don’t equate to large [economic] losses, since not all hurricanes hit urbanized areas. Because of the large population it affected, Ian is going to be the largest wind loss in Florida history.”
Insurers consult with catastrophe modeling firms to access data depicting possible outcomes of an event. These models help companies assess and price the risk of insuring property. After Ian, insurable loss calculations by various firms total between $46.6 billion and $74 billion, making Ian one of the costliest storms in Florida’s history, during a time when supply chain issues and inflation are driving repair costs up.
A shifting climate is raising the cost of living in disaster-prone regions. “Some people have been [in their properties] for 20 or 30 years or more, and the hazard has shifted underneath their feet,” says Mark Bove, a meteorologist and senior vice president of natural catastrophe solutions at Munich Reinsurance America. “With rising sea levels and the potential for more intense hurricanes, the risk and cost of living along the coast is increasing.”
Insurers must also collect premiums that reflect the risk of living in vulnerable places, such as the Florida coast, to remain solvent. Unfortunately, the rising price of insurance becomes another financial burden to those who live in the path of future hurricanes.
Forecasting a hurricane’s footprint
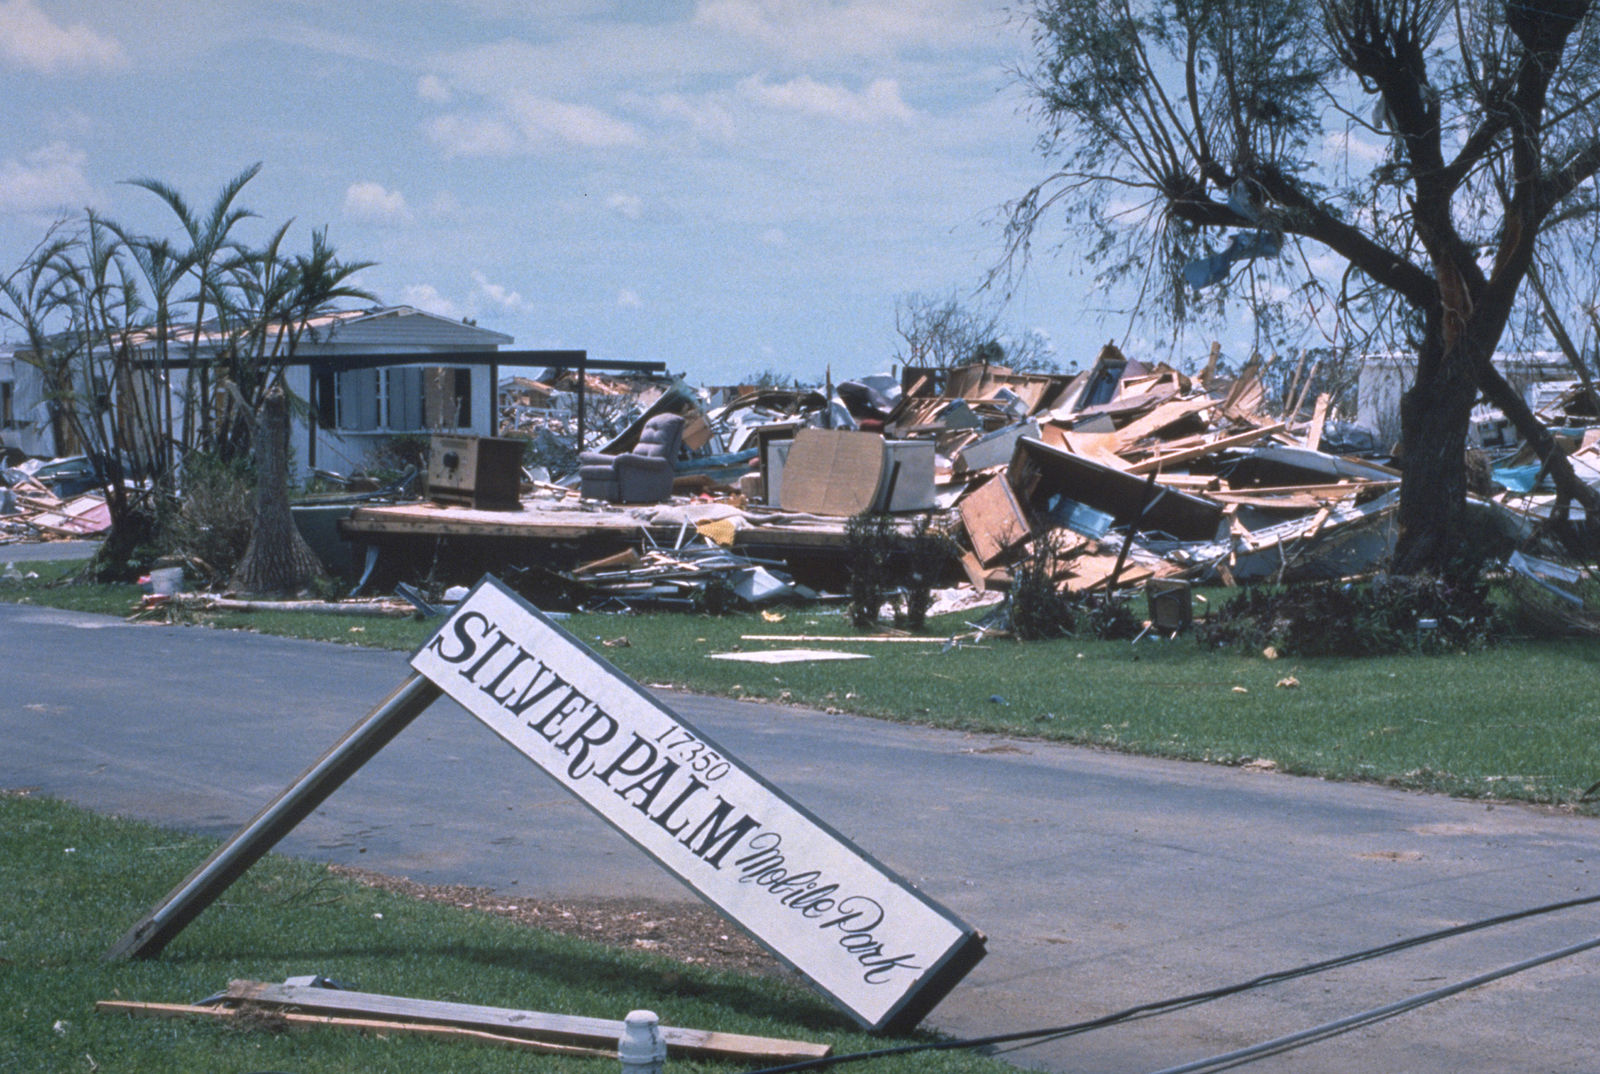
In 1992, category five Hurricane Andrew caused widespread destruction in Florida, Louisiana and the Bahamas. “The losses were ten times what the [insurance] industry had prepared for,” says Larsen. The storm was a catalyst for widespread adoption of more sophisticated catastrophe models that incorporate more statistics and run at higher resolutions, and can factor in incremental changes that may contribute to higher risk, such as sea-level rise. These models also separate the components of a hurricane — wind, flooding and storm surge — and help insurers understand loss from all three types of damage.
Firms such as KatRisk and CoreLogic build models to help companies understand the risks involved in insuring or building properties prone to certain perils. They don’t offer evacuation warnings or weather predictions. Catastrophe models can catalog the likelihood of a hurricane arriving at a given location in the next year, using historical data and manifestations of plausible hurricanes that haven’t happened yet. “They let us look more broadly as to what type of rare events might actually happen,” says Kelly Hereid, director of catastrophe research and development at Liberty Mutual.
Clients can use the models to understand the risk of these events for individual properties, because they include data about the built environment, says Hereid.
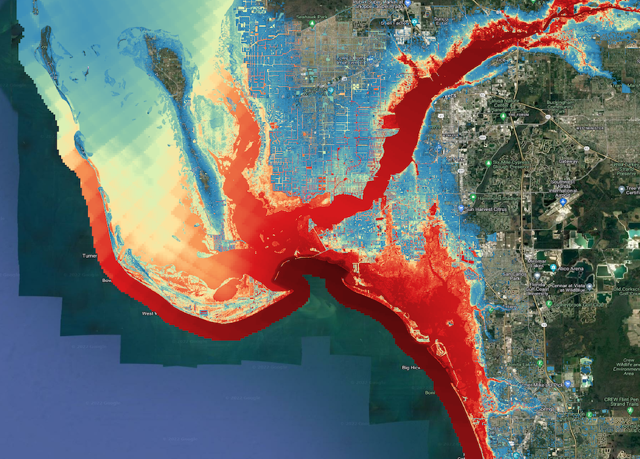
As Ian barreled towards the Florida coastline, KatRisk modeled the hurricane’s footprints — high-resolution images showing possible outcomes of which properties were going to be affected by flooding. When the hurricane was poised to slam into Florida’s west coast, KatRisk provided its clients five different outcomes as Ian made its first and second landfalls. The clients could use that material to assess how important their response to this event would be compared to other disasters in the past ten to fifteen years — how many loss adjustments to expect, how much capital was needed or how many additional resources to deploy, explains Dag Lohmann, CEO of KatRisk.
Modeling for the future
Though there is no definitive answer to the question of whether the number of hurricanes is increasing because of a warming planet, catastrophe models can look to certain trends in intense storms. Ian was consistent with what we know about a changing climate, says Hereid. Sea level rise increased how far inland Ian’s storm surge reached. “Places that would’ve stayed dry without sea level rise can get wet. That tends to be a big factor in increasing losses in a place as flat as Florida.”
Catastrophe models must get three things correct: frequency, severity and correlation — how big a hurricane is, and how many places it can impact at once, says Lohmann. Catastrophe models can offer data that forecast events well into the future. However, insurers tend to focus on the past and present when crafting policies and setting premiums. “Insurance policies really aren’t designed for the timescales that climate change occurs on,” says Bove. “Obviously in certain areas like California, where we’ve seen a lot more wildfire, immediate past history is telling us that something has shifted. It’s hard to understand that rate of change when you’re in the middle of it.”
Wildfires are also changing
On Labor Day, 2020, far from the hurricane-prone shores of coastal Florida, a confluence of high temperatures, persistent drought and a strong east wind set the stage for numerous wildfires to rage across Western Oregon. From California to the Washington border, the sky was orange. Half a million Oregonians, many living close to cities like Portland, Eugene or Medford, were under some level of evacuation warning. Entire towns burned to the ground, and hundreds of thousands of acres of forest were scorched.

To move forward from the trauma of the Labor Day fires, Oregon lawmakers passed SB762, a bipartisan bill that designated $220 million towards modernizing the state’s fire response and creating more fire-prepared communities. It also set aside funding for creating a wildfire risk map indicating every tax lot in the state as well as highlighting the properties that existed along the wildlife-urban interface. Instead of a map that was available to insurers or municipal leaders only, this map would be available to all Oregonians.
“The wildland-urban interface is the fastest growing land use in the United States,” says Erica Fischer, a civil engineer at Oregon State University and a member of SB762’s rules and advisory committee. “Simultaneously, we’re seeing more fires and more landscapes at risk to fires putting those communities under that burden.”
When the wildfire risk map was released in June of 2022, each tax lot in the state was assigned a level of fire risk, from zero to extreme. The Oregon Department of Forestry notified 80,000 residents whose properties on the wildland-urban interface and in the extreme risk category required building code changes. Many residents balked at the mitigation requests. Republican lawmakers protested the map, claiming that insurers were raising prices or dropping clients because of new fire risk designations.
“Insurance is a retroactively priced product, using past history to price future risk. There is significant evidence that wildfire risk is increasing due to climate change, but we only have a few years of data on this new normal,” says Bove. This lack of data makes it difficult for insurers to quantify and incorporate risk into the cost of premiums in fire-prone regions.
After angry town halls and written appeals, the map was withdrawn. The Oregon Division of Financial Regulation explains that the map reflects risk insurers are already aware of through their own models; this was the first time such wildfire risk information was readily available to the public. Oregon insurance companies say they have no plans to use the state’s map, according to a state survey.
“Addressing mitigation practices for existing buildings is extremely important. This was what SB762 was trying to address,” says Fischer. But some argue that the required mitigation measures, such as replacing siding or roofs, were prohibitively expensive for many homeowners. “SB762 has funding for making mitigation accessible for our most socially vulnerable communities — especially those who are going to be hard hit from the disaster itself,” says Fischer.
Ultimately, because the map was rescinded, homeowners in high-risk areas are not required to adapt their properties, leaving Oregon’s future wildfire exposure uncertain, though the state will release a new map in March 2023. Recently, California became the first state to mandate insurers to offer premium discounts for homes that have been hardened against fire risk. Safer from Wildfire, a partnership among the state’s insurance commissioner and various emergency response agencies, provides clear steps for homeowners to build defensible space, making them eligible for a break from skyrocketing insurance costs.

Fires and hurricanes will increase and intensify throughout regions where populations continue to climb, according to climate models. Insurers, residents, and community stakeholders all have a part to play in mitigating damage from a changing climate, such as reinforcing roofs in Florida or building defensible space in Oregon.
Addressing climate risk from hurricane or fire can’t be done in a vacuum, says Hereid. “You can’t solve one piece at a time. You have to get together with your neighbors and your community to reduce the risk in your surrounding neighborhood.”
- Venezuela’s doublet leaned toward Caracas - June 30, 2026
- Is Southern California’s Cajon Pass an ‘earthquake gate’ ready to open? - June 29, 2026
- Philippines magnitude 7.8 shock may have loaded the central Cotabato subduction zone - June 11, 2026