A magnitude-6.1 earthquake that shook western Turkey in November struck a region that also shook in August and November 1999. Reports of shaking revealed significant variation in intensity. Why?
By Haluk Eyidoğan, Ph.D., Professor of Seismology, Istanbul Technical University, Turkey
Citation: Eyidoğan, H., 2023, What happened in Düzce? A preliminary assessment of the November 23 quake in Western Turkey, Temblor, http://doi.org/10.32858/temblor.291
On Nov. 23, 2022, a strong magnitude-6.1 earthquake occurred at 1:08 a.m. (UTC) in Gölyaka District, 16 kilometers west of Düzce Province in western Turkey (Figure 1). The earthquake heavily damaged or destroyed almost 800 buildings and killed two people. It occurred just over a week after Turkey commemorated the anniversary of the November 1999 earthquake that killed 710 people just a bit to the west of the new quake.
The Nov. 23, 2022, earthquake was in the region between the İzmit Fault, which caused a magnitude-7.4 Gölcük earthquake on Aug. 17, 1999, and the Düzce Fault, which caused a magnitude-7.2 earthquake, on Nov. 12, 1999 (Figure 1). Seismological data and field observations of the Nov. 23 Gölyaka earthquake indicate that the earthquake is related to the Karadere Fault, which is 34 kilometers long at the eastern end of the İzmit Fault and oriented in the northeast-southwest direction (Özalp and Kürçer, 2022).

Analysis of the magnitude of the earthquake, the distribution of aftershocks and the location of the earthquake reveals that a 7-kilometer-long part of the right-hand strike-slip Karadere Fault ruptured (Özalp and Kürçer, 2022). The focal mechanism solutions for the event published by various earthquake organizations (e.g., the European-Mediterranean Seismological Centre (EMSC)) confirm that a part of this fault was activated. During the 1999 Gölcük earthquake, the Karadere Fault also moved and created aftershocks in the northeast-southwest direction (Figure 1). However, no obvious faulting traces could be observed in the area related to the earthquake. Özalp and Kürçer (2022) detected some cracks in the field, but they stated that these were lateral spreading fractures formed on alluvial formations during the earthquake (Figure 2). In other words, these features may not indicate surface rupture.

Damage caused by the earthquake
According to the Ministry of Health, two people died in the November 2022 quake, and 93 people were injured to various degrees. According to the statement made by the National Disaster and Emergency Agency (AFAD), almost 800 buildings were heavily damaged, and 2,548 buildings, including some official buildings, were slightly damaged (Figure 3). The worst structural damage occurred in buildings constructed with traditional masonry style that are built on geotechnically weak soils (Özalp and Kürçer, 2022).
Among the 800 buildings that were heavily damaged in the November 2022 Gölyaka earthquake, we wonder if any had not been strengthened or renovated following the 1999 quakes when many buildings in the region were damaged and after which new seismic building standards were enacted. It’s something that bears looking into.
Prof Kaya Özgen in his article on the Gölyaka earthquake, says: “The fact that most of the housing stock in the earthquake area is new buildings built after the 1999 Marmara earthquake seems to be a determining factor in the limited damage and avoidance of collapse; however, the excessive damage in the newly constructed public buildings is thought-provoking.”
AFAD announced that undamaged and slightly damaged buildings can be used by homeowners, but heavily and moderately damaged buildings will be demolished and new buildings will be constructed. In the meantime, 370 barracks were built for temporary shelter for families whose houses were severely damaged.

How severely was the earthquake felt?
Today, with smartphones, it is possible to access earthquake intensity data and analyze the data immediately after an earthquake (Wald et al., 1999; Atkinson and Wald, 2007; Hough, 2012; Bossu et al., 2017). EMSC collects and processes the earthquake intensity information felt and reported by smartphone users and publicly presents the intensity values on the EMS98 scale (Grünthal, 1998). Comparing these intensity data to the multifaceted geological, geophysical and seismological factors that affect the degree of ground movements in earthquake zones, scientists can ascertain information about damages and losses quickly. Additionally, because it is not possible to place earthquake recorders (seismic sensors) everywhere in dense residential areas, important information about the location and building behavior in the earthquake area can be obtained quickly by evaluating the qualitative data from earthquake witnesses.
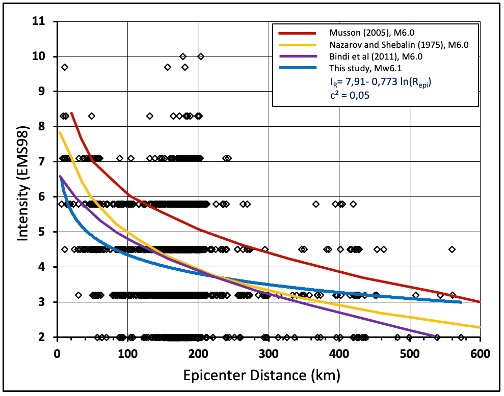
Shortly after the November 2022 earthquake, I downloaded and analyzed 5,220 intensity reports from EMSC (reported by earthquake witnesses and made available to users on the website after EMSC’s rapid processing). When I examined the variation of the intensity data depending on the epicenter distance (Figure 4), I found that values at maximum VII and VIII intensity levels (damaging and heavily damaging) were reported in the EMS98 scale even at long distances compared to the magnitude of the earthquake. The variation of the intensity values depending on the epicenter distance was quite scattered. For example, at distances between 100 and 200 kilometers from the epicenter, low intensity values as well as higher-than-expected intensity perceptions (VII and X) show a dispersed distribution (Figure 4). Scientists look for patterns of how shaking varies with distance from epicenter, which helps determine how the seismic waves radiated away from the source. By creating what’s called an attenuation curve, scientists can see how far the seismic waves reached. I drafted an attenuation curve most compatible with the distribution of the felt report data between the intensity values II and X (Figure 4). For comparison, I included attenuation curves obtained for magnitude-6.0 earthquakes in other seismically active regions of the world (Musson, 2005; Musson et al., 2010; Nazarov and Shebalin, 1975; Bindi et al., 2011).
The intensity attenuation curve calculated in this study for the Nov. 23 earthquake showed higher damping than the curves of other studies, meaning the seismic waves weren’t as big farther away from the earthquake source. In particular, the curve at distances up to 200 kilometers showed a faster decrease. The reasons for this may be the differences in the geological and geophysical properties of the Earth’s crust along the paths of the seismic waves, as well as the descriptions of earthquake witnesses found in many different types of buildings.
When the intensity values shown in Figure 4 are transferred to a map of the region (Figure 5), the decreasing character of the intensity with distance and spatial differences show remarkable features. Especially in densely populated areas (like Istanbul City), people at the same distances experienced quite different earthquake intensity perceptions (Figure 5). Even at 140 kilometers from the epicenter of the magnitude-6.1 earthquake, intensity perceptions ranging from VI to VIII were reported. Some reasons for this may include: structural features of buildings, seismic structure of the Earth’s crust, site soil condition, building height, and static and dynamic design. In addition, the perception sensitivity level of earthquake witnesses is also an important factor in determining the intensity value. Not everyone who experiences the same level of shaking will describe it the same.

Ground motion data, mostly obtained from accelerometers placed on the Earth’s surface in positions that will not be affected by building behavior during an earthquake, provide more objective and quantitative information about shaking than the perceptions of people in buildings with different ground characteristics, types and heights. Therefore, the building effect is minimal in the acceleration values recorded on the ground. So, in order to evaluate the qualitative intensity data more objectively, I used earthquake seismic data recorded with 181 three-component accelerometers operated by AFAD-TADAS.
First, I looked at the variation of the peak ground acceleration (PGA) and ground motion velocity (PGV) values with respect to the epicenter distance (Figure 6). Although scattering is observed at some distances in the PGA and PGV values plotted on the logarithmic axis, the scattering rate is less than the scattering in the intensity values. Secondly, I compared the graphs of the variation of PGA and PGV values with epicenter distance by matching the values of the Modified Mercalli Intensity (MMI) scale (Figure 6). It is known that the MMI scale is almost equivalent to the EMS98 scale (Musson et al. 2010). The U.S. Geological Survey has developed a scale linking the intensity values of PGA, PGV and Modified Mercalli Scale (MMI) in order to prepare shake maps. Using these scales, we can see the distribution of PGA and PGV in Figure 6 together with the MMI intensity distribution values. According to this distribution, it is understood that the most felt intensity values up to 260 kilometers from the earthquake center are between IV and V intensities.


Spectral response characteristics in the structural damage region
The ground response function is used to express the effect of local ground conditions on the seismic vibrations generated in the earth during an earthquake. These functions give the amplitude values of the vibration character of the ground in different periods. Ground response functions are required to determine the period-dependent responses (called spectral responses) of any building during an earthquake for earthquake resistant design. Spectral response functions are determined based on various ground conditions and are included in building earthquake codes. It is assumed that the ground moves within the linearity limits (elastic limits) during an earthquake.
Acceleration records taken from five stations on the Quaternary-aged alluvial plain, where the damage due to the earthquake was intense, were examined. The five accelerometers — 8101, 8102, 8104, 8106 and 8109 — operated by AFAD-TADAS are located at distances ranging from 5 to 14 kilometers from the earthquake epicenter (Figure 7). The Vs30 values determined by AFAD for the ground where the five recorders are located vary between 183 m/s and 398 m/s (Figure 8). According to the Eorocode-8 values, the 8104 coded recorder is on type B ground (rock or deposits of very dense sand, gravel and stiff clay), while the others are on type C ground (dense or medium-dense soil, sand, gravel and clay).
When we look at the observational response spectra calculated by AFAD, we can see an increasing trend in the spectral amplitude in the response spectra in the periods between 1 second and 2 seconds, except for the location of 8106. While this increase is at the spectral amplitude limit at locations 8101, 8104 and 8109, it exceeds the spectral amplitude value allowed in the TBEC (2018) regulation at location 8102 by 40 percent (Figure 8).

Düzce city is the closest settlement to the earthquake center and has the highest population. According to the information obtained from the official damage reports, the heavily damaged buildings are generally on the Quaternary-aged alluvium Düzce Plain, where Düzce city center and its affiliated settlements are located (Figure 7).
Considering that the maximum acceleration levels recorded by the accelerometers in Düzce Plain vary between 307 cm/s2 and 408 cm/s2 (Figure 8), a significant relationship can be established between the heavy damage distribution and the maximum acceleration levels. In addition, the high acceleration response between 1 second and 2 seconds in the east-west direction in the 8102 coded location is a remarkable phenomenon in terms of damages.
References
Atkinson, G. M. and Wald, D. J., 2007. “Did You Feel It?” Intensity data: a surprisingly good measure of earthquake ground motion, Seismological Research Letters, 78 (3), 362–368.
Barka, A. A., Akyüz, S., Altunel, E., Sunal, G., Çakır, Z., Dikbaş, A., Yerli, B., Rockwell, T., Dolan, J., Hartleb, R., Dawson, T., Fumal, T., Langridge, R., Stenner, H., Christofferson, S., Tucker, A., Armijo, R., Meyer, B., Chabalier, J., B., Lettis, W., Page, W. and Bachhuber, J. 2000. The August 17, 1999 İzmit earthquake, M= 7.4, Eastern Marmara region, Turkey: study of surface rupture and slip distribution. In: Barka, A.A., Kozacı, Ö., Akyüz, S. & Altunel, E. (eds), The 1999 İzmit and Düzce Earthquakes: Preliminary Results. İstanbul Technical University, İstanbul, 15–30.
Bindi, D., Parolai, S., Oth, A., Abdrakhmatov, K, Muraliev, A. and Zschau, J., 2011. Intensity prediction equations for Central Asia, Geophys. J. Int., 187, 327–337.
Bossu, R., Landès, M., Roussel, F., Steed, R., Mazet.Roux, G., Martin, S. S. and Hough, S., 2017. Thumbnail‐based questionnaires for the rapid and efficient collection of macroseismic data from global earthquakes, Seismological Research Letters, 88 (1), 72–81.
Emre, Ö., Duman, T.Y., Özalp, S., Şaroğlu, F., Olgun, Ş., Elmacı, H. and Çan, T., 2018. Active fault database of Turkey. Bulletin of Earthquake Engineering, 16 (8), 3229-3275.
EMSC Felt reports, 2022. http://www.seismicportal.eu/testimonies-ws/
Eyidoğan, H., Haessler, H., Polat, O., Cisternas, A., Gürbüz, C., Frogneux, M., Aktar, M., Üçer, B., Bouchon, M., Comte, D., Philip, H., Kaypak, B., Ergin, M., Karabulut, H., Akıncı, A., Kuleli, S. and Yörük, A., 2000. August 17, 1999, Kocaeli (İzmit) Earthquake: before, during and after. In: Barka, A., Kozacı, Ö., Akyüz, S., Altunel, E. (Eds.), The 1999 İzmit and Düzce earthquakes: preliminary results, İstanbul Technical Univ. Press, İstanbul, pp. 161-169.
Grünthal, G., 1998. European Macroseismic Scale 1998. Cahiers du Centre Europèen de Gèodynamique et de Seismologie, No. 15. (Luxembourg: Conseil de l’Europe.), 1-69.
Hough, S. E., 2012. Initial assessment of the intensity distribution of the 2011 Mw5.8 Mineral, Virginia, Earthquake Seismological Research Letters. 83, Number 4 July/August 2012, 649.
Düzce’de Depremde Evleri Ağır Hasar Gören Vatandaşlarımız İçin Konteynerler Kuruluyor, 2022. https://www.icisleri.gov.tr/duzcede-depremde-evleri-agir-hasar-goren-vatandaslarimiz-icin-konteynerler-kuruluyor
Musson, R. M. W., 2005. Intensity attenuation in the U.K., Journal of Seismology, 9, 73–86.
Musson, R. M. W., Grünthal, G. and Stucchi, M., 2010. The comparison of macroseismic intensity scales, Journal of Seismology, 14, 413–428.
Nazarov, A. G. and Shebalin, N. V. (Eds), 1975. The Seismic Scale and Methods of Measuring Seismic Intensity, Nauka, Moscow (in Russian).
Özalp, S. and Kürçer, A., 2022. 23 Kasım 2022 Gölyaka (Düzce) Depremi (Mw 6,0) Saha Gözlemleri ve Değerlendirme Raporu, MTA Jeoloji Etütleri Dairesi Başkanlığı, Ankara, Türkiye, 30 s.
Polat, O., Eyidoğan, H., Haessler, H., Cisternas , A. and Philip, H., 2002. Analysis and interpretation of the aftershock sequence of the August 17, 1999 İzmit (Turkey) earthquake, Journal of Seismology, Special İzmit Issue, 6, 3, 287-306.
TBEC-2018, Türkiye Bina Deprem Yönetmeliği, Afet ve Acil Durum Yönetimi Başkanlığı, Ankara, Türkiye, Mart 2018.
Turkish Acceleration Database and Analysis System (AFAD TADAS), 2022. https://tadas.afad.gov.tr
Wald, D. J., Vincent Quitoriano, V., Dengler L. A. and Dewey, J. W., 1999. Utilization of the Internet for Rapid Community Intensity Maps, Seismological Research Letters, 70 (6): 680–697.
- Venezuela’s doublet leaned toward Caracas - June 30, 2026
- Is Southern California’s Cajon Pass an ‘earthquake gate’ ready to open? - June 29, 2026
- Philippines magnitude 7.8 shock may have loaded the central Cotabato subduction zone - June 11, 2026