Ross Stein and Volkan Sevilgen, Temblor
Citation: Stein R.S., Sevilgen V., 2016, Italy earthquake leaves seismic gaps that were last filled by three large earthquakes in 1703, Temblor, http://doi.org/10.32858/temblor.006
Sixty-two hours after the M=6.2 Rieti, Italy, mainshock, we are continuing to take a close look. Here are what strike us as the most important findings and issues.
Why so damaging?
To calibrate the USGS PAGER system that forecasts casualties and economic consequences of earthquakes immediately after they occur, Kishor Jaiswal and David Wald of the USGS analyzed quake deaths from around the world during 1973-2009. Shockingly, they found that if 10,000 people were subjected to violent shaking (‘Modified Mercalli Intensity IX’), in Iran 3,000 would die; in Italy 150, and in California just 3. In this quake, about 10,000 people were exposed to severe shaking (‘Modified Mercalli Intensity IX’), and so the current death toll is, sadly, consistent with their estimate. None of these disparities are caused by differences in shaking; all are due to construction. The entire Abruzzo region was destroyed in 1703, and so many buildings date from the early 1700’s. Buildings more than a century old are typically made of heavy unreinforced stones and cannot resist the side-to-side shear forces exerted by even a modest quake like this one.
What’s to be done? Earthquake Early Warning systems would not have worked for this small quake; the distances from the epicenter to the towns are so short that the shaking would have beaten the electronic warning to people’s cell phones and public sirens. A very dense seismic network would have afforded several seconds of warning to Norcia and Amatrice, enough time to dive under a bed but not to get out of a building. It is difficult and expensive—but nevertheless possible—to retrofit ancient or old buildings, but at the very least, schools and public buildings need to conform to a much higher standard. Homeowners should investigate retrofitting or moving to new homes; one can also insure against earthquakes for financial protection.
No precursory swarm
A political and legal struggle arose after the 2009 L’Aquila earthquake over whether the population was adequately warned about a potential earthquake. The broad region—but not L’Aquila itself—experienced a seismic swarm for a month or so before the mainshock. Later, the local prosecutor argued that the politicians and scientists had not adequately warned that a swarm could portend a mainshock. The resulting manslaughter convictions of the scientists were, fortunately and appropriately, overturned, but only years later.

But at least at the level of M≥2, the 24 August 2016 M=6.2 quake was not preceded by a swarm. In fact, there was only one M=2.2 shock near the future rupture zone during the 30 days before the mainshock struck (see map above). Instead, there is a 200-km-long zone of M≤2 seismicity that extends from L’Aquila to the northwest, which is just evident in the map of M≥2 shocks, and its shock rate has been steady for a decade. The absence of a precursory swarm is not a surprise: As the scientists argued before the prosecutor, swarms seldom occur except at volcanic sites or along creeping faults, and only rarely are they harbingers of future mainshocks. In this quake, the Gods answered the lawyers: Earthquakes cannot be predicted, at least not yet.
Progressive earthquake failure in 1703
But there is another remarkable feature of this part of the Apennines: Three earthquakes struck over a period of 19 days in 1703 in a 36-km southeastward progression (Guidoboni and Valensise, 2015). The epicenters were near Norcia (M~6.7 on 14 Jan 1703), Montereale (M~6.2 on 16 Jan 1703) and L’Aquila (M~6.7 on 2 Feb 1703), rupturing all of the known active faults between Norcia and L’Aquila. About 10,000 people died in this 19 days of terror, although casualty numbers remain highly uncertain.
Could this happen again now? As with precursory swarms, progressive earthquake sequences are uncommon. All one can say is that because this has happened in the past, and because it multiple ruptures and very large aftershocks are historically common here, it could happen again. So, one should not assume or assure anyone that this earthquake sequence is over.

Mind the Gaps
There appears to be 20-km-long (12 mi) gaps between the 24 August 2016 quake and the 1997 Umbria-Marche quake to the northwest and the 2009 L’Aquila shock to the southeast. These gaps have a history of moderate or large quakes, so they certainly are not aseismic. Galli, Galadini and Calzoni (2005) found evidence of repeated surface ruptures in the past 20,000 years along the Norcia fault zone that extends through this region. Therefore, another M~6 quake is still possible—but by no means imminent.
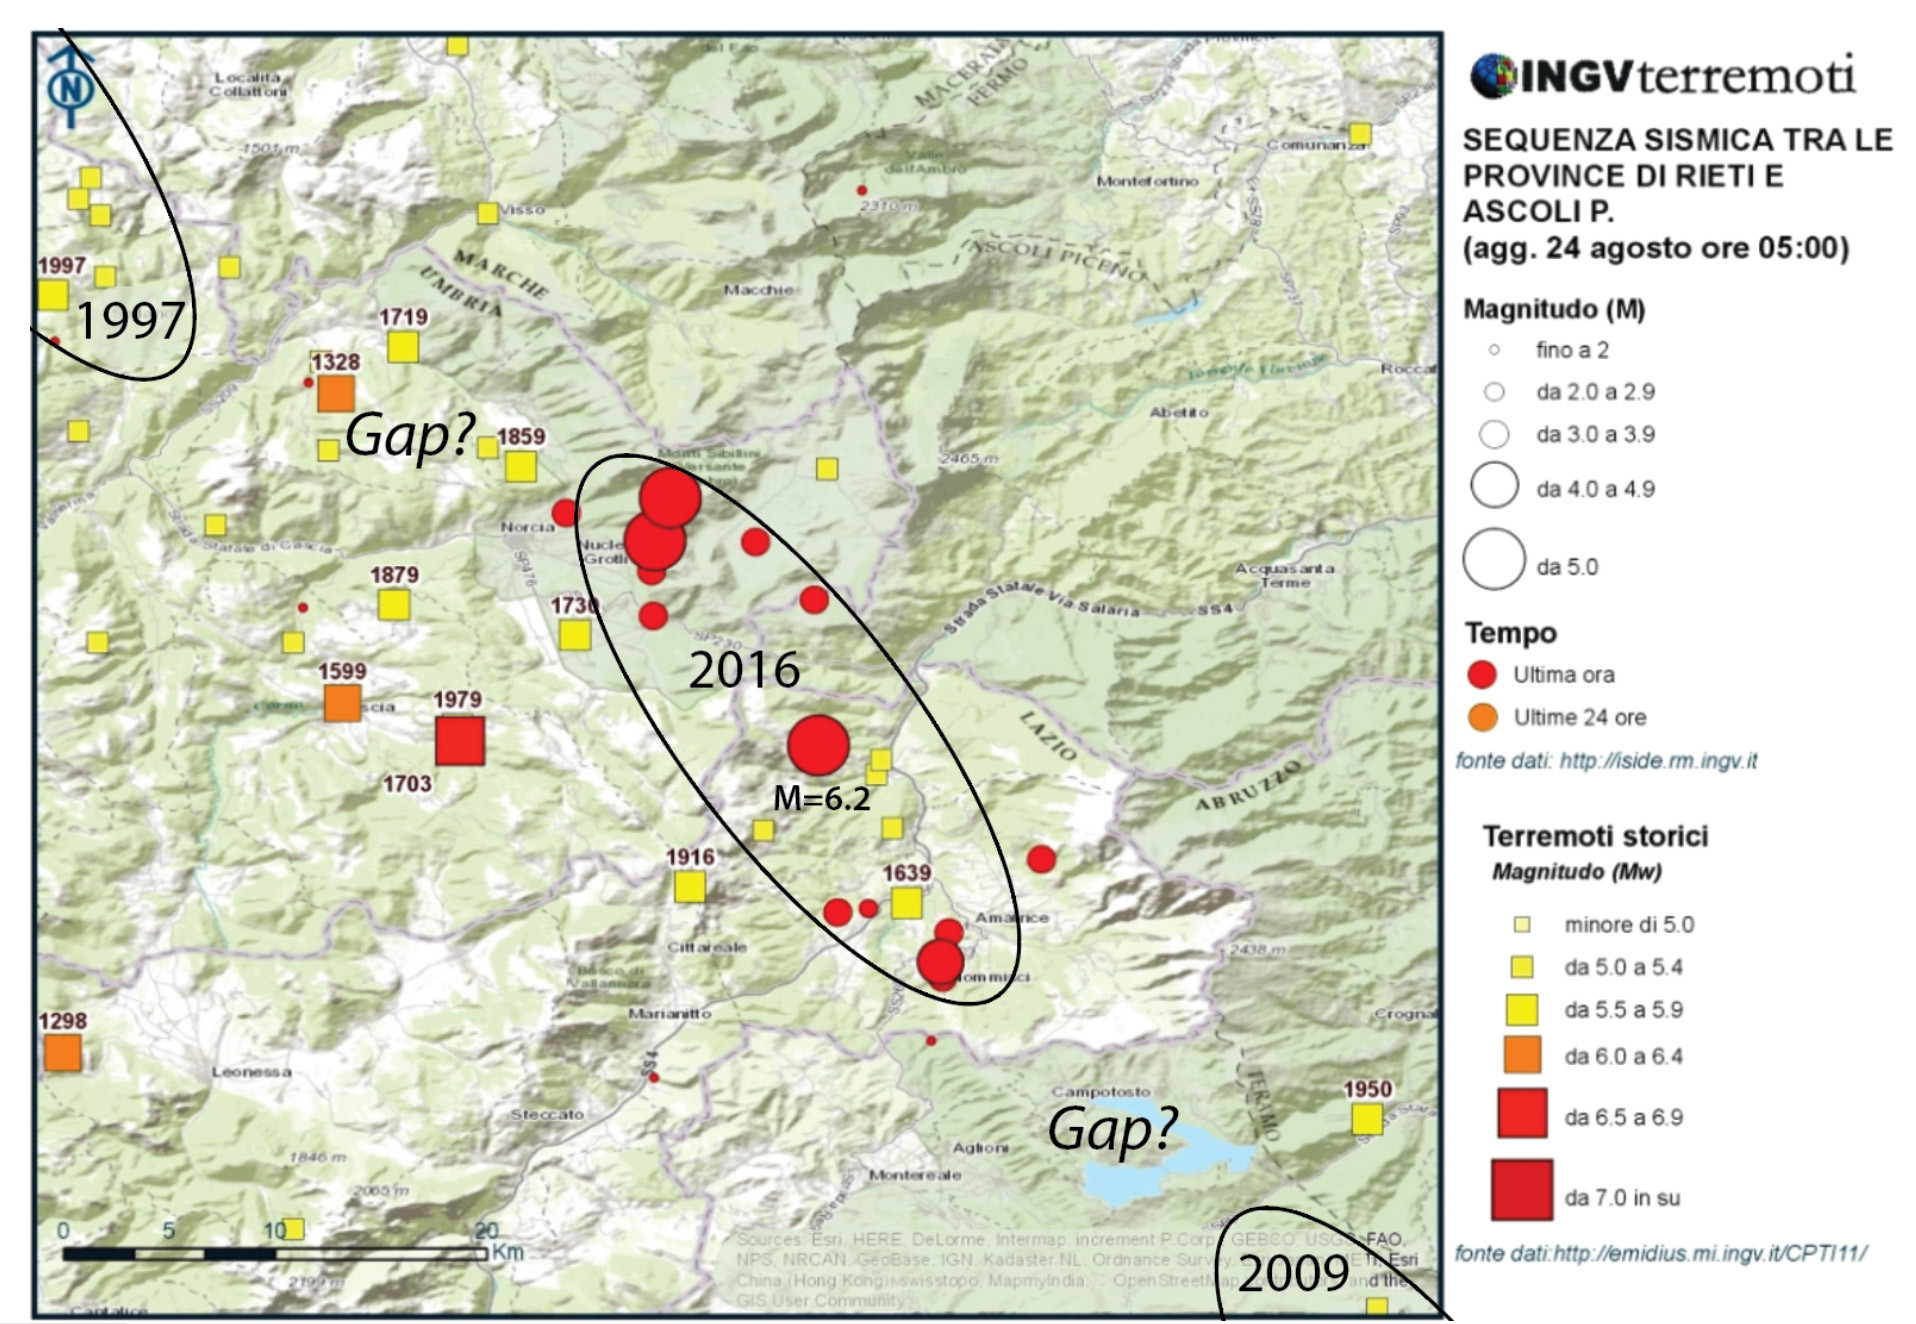
The 24 August 2016 M=6.2 earthquake struck between the sites of the 1997 M=6.1 Umbria-Marche shock to the northwest, and the 2009 M=6.3 L’Aquila shock to the southeast. This leaves potential gaps, at least since 1859, between the recent quakes, where another M~6 shock could conceivably strike. (Annotated from an INGV map).
The extent of the rupture is best assessed not by the aftershocks, but by the ground deformation. That’s because aftershocks can strike well off the rupture in areas where the stress has been increased by the mainshock. Here, below, is the first accessible radar image of the ground deformation, called an ‘interferogram;’ it differences radar images made about a year before and the day after the mainshock. One can see that the deformation is about 20 km long. The yellow area to the west is uplifted, while the central fringes or contours indicate subsidence. So, there are indeed gaps between this shock and the sites of the 1997 and 2009 shock.

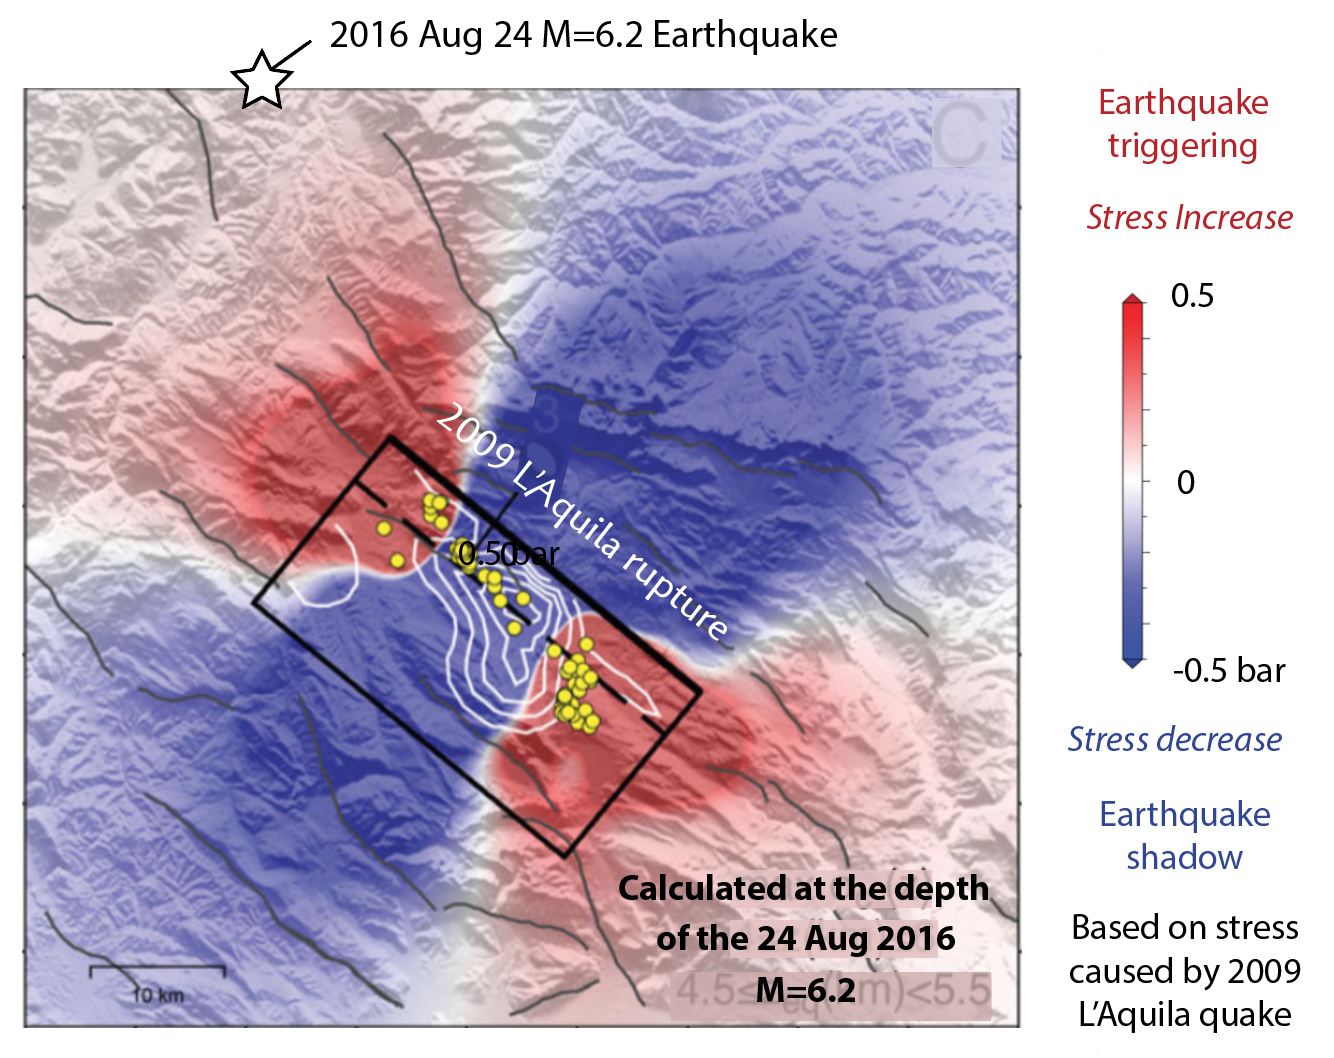
Was the mainshock triggered by the 2009 L’Aquila earthquake?
The answer is a qualified yes. Serpelloni, Anderlini, and Belardinelli (2012) calculated the Coulomb stress transfer to the region surrounding the 2009 quake. One can see in the map below that the 24 August 2016 mainshock was brought closer to failure, but only by about 0.05-0.10 bar. Generally, stress increases of ≥0.1 bar are associated with aftershocks and an increased probability of future mainshocks. So the effect is small but positive.
How good was the national seismic hazard map?
One can only assess a probabilistic hazard map by looking at hundreds of large quakes, but if we had to judge it by this one alone, it was excellent. The M=6.2 quake struck in the most seismically active part of Italy, and the observed shaking was about at the maximum level forecast by the map. The map is based on the modern and ancient record of earthquakes, on the identification of active faults, and on the crustal strain measured by GPS receivers—just as the maps in the U.S. and Japan are based.

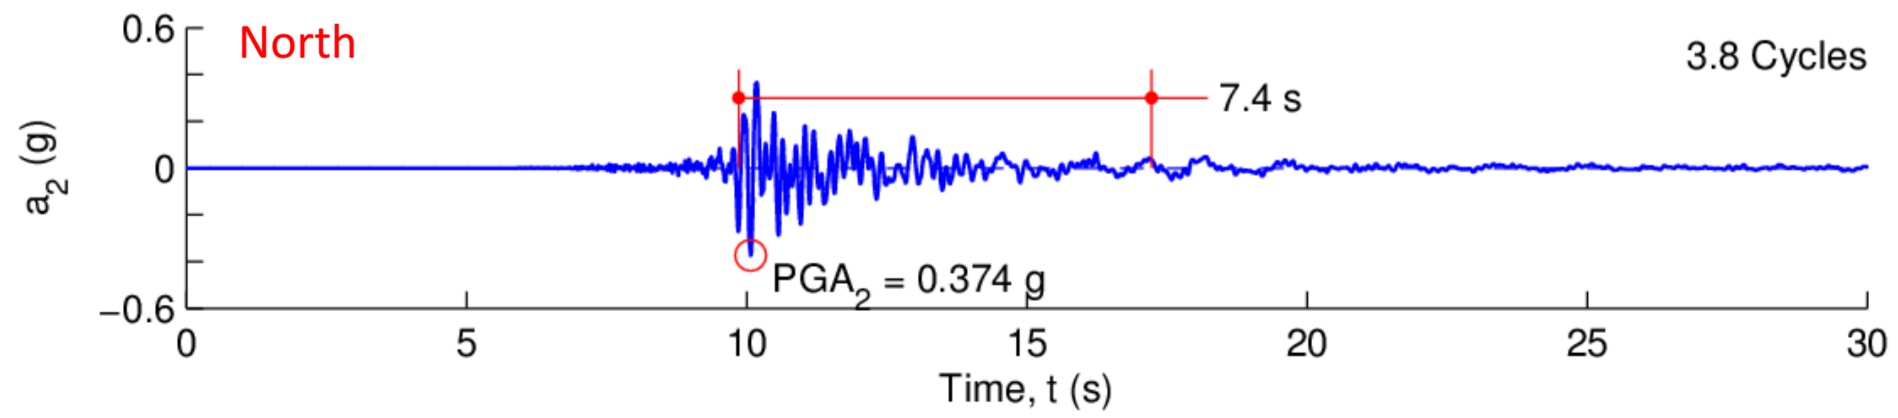
Here, below, is the highest recorded ground acceleration we have seen so far. The strong shaking lasted only for 3-4 seconds and peaked at a relatively modest 0.375 g (we are all accelerated downward at 1.0 g; if we were accelerated upward at 1 g, we would lift off the ground). Well-built wood frame homes should come through this level of shaking unscathed. On the basis of damage, it is possible—but doubtful—that the shaking was much stronger at Amatrice. The mainshock lies between these two towns and so the seismic waves traveled in both directions toward them, and so should be comparable. Sadly, this Norcia record is a strong indictment of the poor building quality. Seismometers don’t lie.
Updated: 9:00 am PDT 29 Aug 2016
Citation: Stein R.S., Sevilgen V., 2016, Italy earthquake leaves seismic gaps that were last filled by three large earthquakes in 1703, Temblor, http://doi.org/10.32858/temblor.006
References:
Data from INGV (Istituto Nazionale di Geofisica e Volcanologia), EMSC (European‑Mediterranean Seismological Centre), Italian National Strong Motion Network (RAN), which is managed by the Italian Department of Civil Protection, USGS, and a conversation with Gianluca Valensise, Director of Research at the INGV.
Bird, P., D. D. Jackson, Y. Y. Kagan, C. Kreemer, and R. S. Stein (2015). GEAR1: A Global Earthquake Activity Rate Model Constructed from Geodetic Strain Rates and Smoothed Seismicity, Bull. Seismol. Soc. Amer. 105, 2538-2554, doi: 10.1785/0120150058.
Galli, P., F. Galadini, and F. Calzoni (2005), Surface faulting in Norcia (central Italy): A paleoseismological perspective, Tectonophysics, 403 117–130, doi:10.1016/j.tecto.2005.04.003
Guidoboni, Emmanuela, and Gianluca Valensise (2015), On the complexity of earthquake sequences:A historical seismology perspective based on the L’Aquila seismicity (Abruzzo, Central Italy), 1315-1915, Earthquakes and Structures, 8, 153-184, doi: 10.12989/eas.2015.8.1.153
Jaiswal, K., and D. Wald (2010), An Empirical Model for Global Earthquake Fatality Estimation, Earthquake Spectra, 26, 1017-1037, DOI: 10.1193/1.3480331.
Serpelloni E., Anderlini L., and Belardinelli, M.E., (2012) Fault geometry, coseismic-slip distribution and Coulomb stress change associated with the 2009 April 6, Mw 6.3, L’Aquila earthquake from inversion of GPS displacements, Geophys. J. Int., 188, 473–489 doi: 10.1111/j.1365-246X.2011.05279.x
- Structures can be both earthquake-resilient and sustainable - July 19, 2024
- Earthquakes rattle Palawan, Philippines: Is the region as stable as we thought? - July 3, 2024
- Seismic retrofit rates highlight inequitable efforts - June 20, 2024