By: Ian Stone, Ph.D. candidate, University of Washington (@NoisyRocks)
Cascadia has experienced major earthquakes in the past. Should another occur today, the region’s cities would feel intense shaking — some more than others.
Citation: Stone, I., 2020, Five Puget Sound cities likely to feel strong shaking in a megaquake, Temblor, http://doi.org/10.32858/temblor.094
Although Washington State’s Puget Sound has been shaken every few decades, damage in the region’s largest cities, including Seattle, Tacoma and Olympia, has only ever been modest.
However, an enormous threat lurks just off the coast of the Pacific Northwest. Here, the Juan de Fuca tectonic plate is jammed beneath the North American plate at a rate of a few centimeters per year. The interface of the two plates is the Cascadia subduction zone, a fault that has generated magnitude-8.0+ earthquakes over intervals spanning many centuries. The region’s last major earthquake was in 1700, when an approximate magnitude-9.0 earthquake ruptured the full length of the fault, which extends from off the coast of Northern California to Vancouver Island in Canada.

A repeat of the 1700 earthquake today would cause extensive damage throughout the Pacific Northwest. The risk is particularly high in the Puget Sound, where major population centers are growing directly in harm’s way.
A geologic mystery is solved
The 1700 quake occurred two centuries before seismometers were invented and widely installed. We therefore do not have direct measurements of how large the earthquake was. Magistrate records from Eastern Japan and Native American oral histories from the Pacific Northwest do, however, suggest a large wave of water swept through these regions around this time. It wasn’t until 20th century researchers compared these records with coastal geology that the source of this tsunami was identified: a magnitude-9.0 earthquake on the Cascadia subduction zone (Atwater et al., 2005; Satake et al., 2003; Ludwin et al., 2005).
A disaster in the making
Since the start of European settlement in the late 19th century, the population of the Pacific Northwest has grown into the millions, and the region is currently experiencing one of the largest population booms in the country. Within Washington State’s Puget Sound region, urbanization has transformed muddy tidal flats into the bustling port cities of Seattle, Tacoma and Olympia, which have rapidly grown into huge tech and manufacturing hubs. Most of this urbanization took place prior to the realization of the danger posed by a possible megathrust earthquake.

Knowing how the 1700 event shook the region would provide valuable information about which areas need more preparation before the next great Cascadia earthquake. While there are not seismological recordings of the last Cascadia earthquake, seismologists can simulate ground shaking using information about the fault and observations from other subduction zone earthquakes. With these results, we can see which parts of the Puget Sound would experience the strongest shaking during a possible repeat of the 1700 quake.
Estimated shaking in the Puget Sound
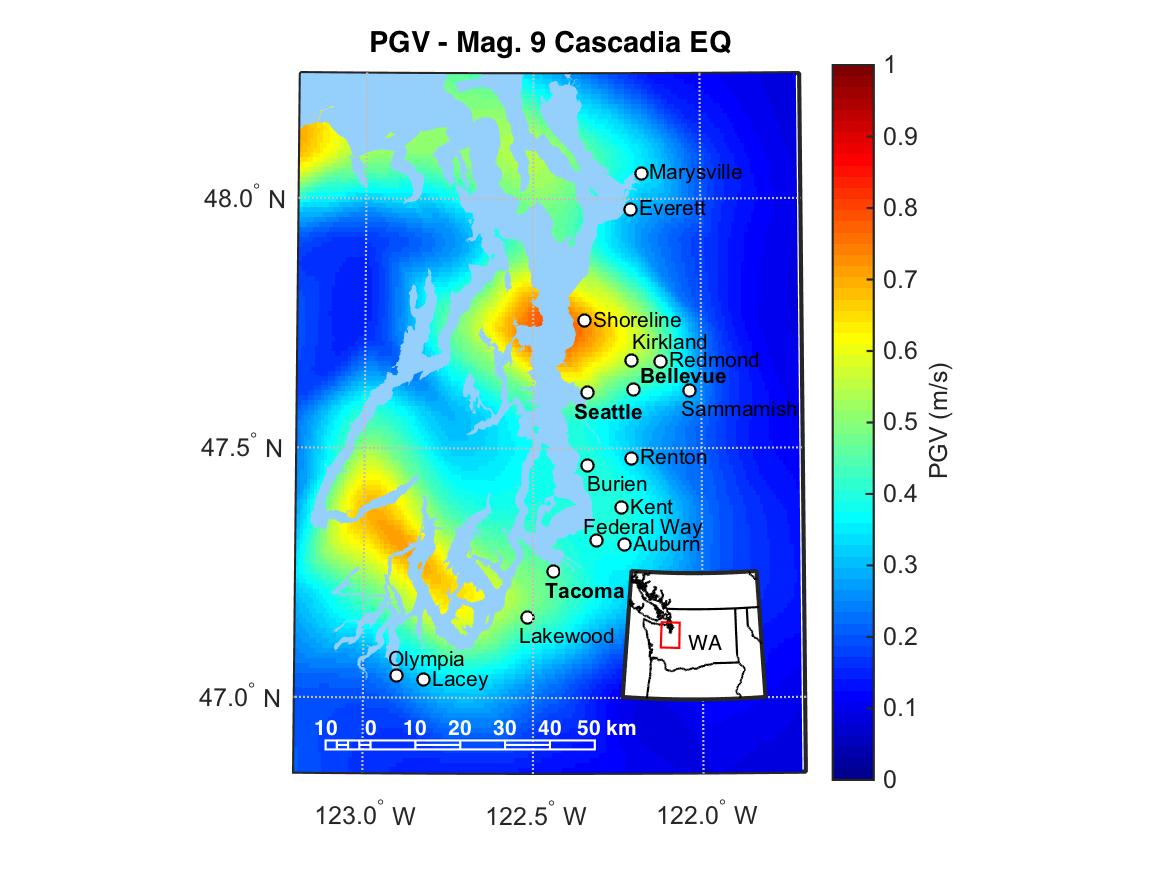
Simulated peak ground velocities from a magnitude-9.0 earthquake on the Cascadia Subduction Zone (taken from the results of Frankel et al., 2018 and Wirth et al., 2018) highlight differences in the effect of such an earthquake throughout the Puget Sound region. The peak ground velocity describes the maximum speed at which the ground moves during an earthquake and typically correlates well with felt shaking intensity — and damage — during large earthquakes. As a point of comparison, a peak ground velocity of 1.1 miles per hour (0.5 meters/second) was strong enough to tip over train cars during the 1906 magnitude-7.0 San Francisco earthquake (Veeraraghavan et al., 2019).
Since we do not know where the hypocenter was or the exact slip distribution for the 1700 earthquake, what’s shown in the map is the average peak ground velocity from thirty different rupture scenarios, each considering a different hypocenter and slip distribution. While the peak ground velocity for a city may change from one rupture scenario to another, the relative response between cities is often similar, since shaking is strongly influenced by geologic structure and fault location. Using these data, we can estimate which cities with a population greater than 50,000 in the Puget Sound region are expected to experience the strongest shaking.
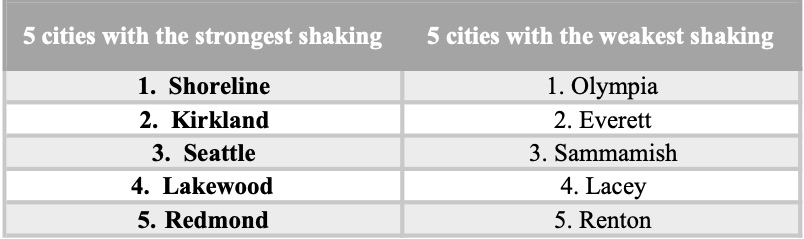
These results might not be immediately intuitive. After all, Olympia, which is the closest of the cities to the megathrust fault, is estimated to experience the least severe shaking; at the same time, many cities on the east side of the Puget Sound — further away from the fault — experience much stronger shaking. This oddity may be attributed to the effect of sedimentary basins, which trap and amplify seismic waves. Shoreline sits near the middle of the Seattle Basin, which is why it is estimated to experience the strongest shaking, with a peak ground velocity around 1.6 miles per hour (0.7 meters/second). Cities with the lowest amount of estimated shaking are either located away from sedimentary basins or are further to the east. Topping this list are Olympia, Everett and Sammamish, all of which are estimated to experience a peak ground velocity around 0.7 miles per hour (0.3 meters/second).
It is important to emphasize that when it comes to earthquake damage, the estimated shaking mapped above will only be part of the equation. Factors like construction quality and local soil conditions will play an important role in how much a structure is damaged. For instance, a well-built house on hard rock in a strong shaking area might fare better than a poorly built house on sand or artificial fill in a weak shaking area. The results presented here do not consider localized soil conditions, so shaking at a given location may end up being stronger (or weaker) than what is shown.
It is also important to point out that the city with the “weakest” shaking in this analysis (Olympia) is still estimated to have a peak ground velocity near 0.7 miles per hour (0.3 meters/second), which is strong enough to be widely felt and cause modest localized damage.

Preparing for the next earthquake
When the subduction zone ruptures again, the earthquake will only be the start of the disaster. It is expected that a repeat of the 1700 earthquake would cripple infrastructure throughout the entire Pacific Northwest, and for many weeks following the disaster, citizens of the area will have to learn to live without access to fully functioning roads, water, electricity and sewage, according to the Cascadia Region Earthquake workgroup 2013 report. This is doubly true for more remote regions of Western Washington and Oregon.
The estimated likelihood of another magnitude-9.0 earthquake on the Cascadia Subduction Zone over the next 50 years sits at around 15% (Goldfinger et al., 2017). The likelihood of a magnitude-8.0 or larger earthquake in the same time period, which would partially rupture the fault and still do a significant amount of damage, is around 40% (Goldfinger et al., 2012). Also consider that a magnitude-9.0 mainshock can produce an approximately magnitude-8.0 aftershock, as happened 30 min after the magnitude-9.0 Tohoku, Japan, megathrust earthquake in 2011.
You can use the Temblor app to look at the impact of a magnitude-9.0 earthquake on your home, in terms of cost and repair time, in the Temblor app. Temblor finds your location, grabs information about your home from public databases and uses USGS, FEMA, and Washington Geological Survey data and models to estimate your own losses.
It’s important that those living in the Pacific Northwest have a personal disaster plan. Emergency managers recommend having a cache of water and non-perishable foods that will sustain you and your family for up to fourteen days. Other suggestions on building an emergency plan may be found at the Washington Emergency Management website.
This article is the first in a series on earthquake hazards in the Puget Sound region. Stay tuned for detailed analyses on the regions mentioned.
Want to know your earthquake risk? Check it on Temblor.
Further Reading
Atwater, B. F., Musumi-Rokkaku, S., Satake, K., Tsuji, Y., Ueda, K., & Yamaguchi, D. K. (2005). The orphan tsunami of 1700 – Japanese clues to a parent earthquake in North America: USGS Professional Paper 1707. https://pubs.er.usgs.gov/publication/pp1707
Frankel, A. D., Wirth, E. A., Marafi, N., Vidale, J., & Stephenson, W. J. (2018). Broadband synthetic seismograms for magnitude 9 earthquakes on the cascadia megathrust based on 3D simulations and stochastic synthetics, Part 1: Methodology and overall results. Bulletin of the Seismological Society of America, 108(5), 2347–2369. https://doi.org/10.1785/0120180034
Goldfinger, C., Galer, S., Beeson, J., Hamilton, T., Black, B., Romsos, C., Patton, J., Nelson, C. H., Hausmann, R., & Morey, A. (2017). The importance of site selection, sediment supply, and hydrodynamics: A case study of submarine paleoseismology on the northern Cascadia margin, Washington USA. Marine Geology, 384, 4–46. https://doi.org/10.1016/j.margeo.2016.06.008
Goldfinger, C., Nelson, H. C., Morey, A. E., Johnson, J. E., Patton, J. R., Karabanov, E., Gutierrez-Pastor, J., Eriksson, A. T., Gracia, E., Dunhill, G., Enkin, R. J., Dallimore, A., & Vallier, T. (2012). Turbidite event history — Methods and implications for Holocene paleoseismicity of the Cascadia subduction zone: USGS Professional Paper 1661-F. https://pubs.usgs.gov/pp/pp1661f/
Ludwin, R. S., Dennis, R., Carver, D., McMillan, A. D., Losey, R., Clague, J., Jonientz-Trisler, C., Bowechop, J., Wray, J., & James, K. (2005). Dating the 1700 Cascadia earthquake: Great coastal earthquakes in Native stories. Seismological Research Letters, 76(2), 140–148. https://doi.org/10.1785/gssrl.76.2.140
Satake, K., Wang, K., & Atwater, B. F. (2003). Fault slip and seismic moment of the 1700 Cascadia earthquake inferred from Japanese tsunami descriptions. Journal of Geophysical Research, 108(B11, 2535). https://doi.org/10.1029/2003JB002521
Wirth, E. A., Frankel, A. D., Marafi, N., Vidale, J. E., & Stephenson, W. J. (2018). Broadband synthetic seismograms for magnitude 9 earthquakes on the cascadia megathrust based on 3D simulations and stochastic synthetics, Part 2: Rupture parameters and variability. Bulletin of the Seismological Society of America, 108(5), 2370–2388. https://doi.org/10.1785/0120180029
Veeraraghavan, S., Heaton, T. H., & Krishnan, S. (2019). Lower Bounds on Ground Motion at Point Reyes during the 1906 San Francisco Earthquake from Train Toppling Analysis. Seismological Research Letters, 90(2A), 683-691. https://doi.org/10.1785/0220180327
- Venezuela’s doublet leaned toward Caracas - June 30, 2026
- Is Southern California’s Cajon Pass an ‘earthquake gate’ ready to open? - June 29, 2026
- Philippines magnitude 7.8 shock may have loaded the central Cotabato subduction zone - June 11, 2026