La versión en español de la publicación del blog se puede encontrar aquí
by Gabriel Lotto and Ross Stein, Temblor
We first posted about the 16 April 2016 M=7.8 Ecuador earthquake one day after it struck. At that time, we judged that it was likely a repeat of a 15 May 1942 M=7.8 quake that ruptured the same plate boundary just a few tens of kilometers south. We also pointed to a potential “seismic gap” north of the 2016 event, a segment of the subduction zone where no large earthquake has struck since the 1906 M~8.8 megaquake. We said that this gap could potentially host another earthquake of M~7.8, a terrifying prospect if you live in coastal Ecuador.
Now, three months later, what do we know about the Ecuador earthquake that we didn’t know before?
First, we have a better sense of the devastation it unleashed. More than 650 people were killed and thousands more were injured. The earthquake caused billions of dollars of damage, and many thousands of people were left homeless or without access to critical infrastructure. One third of the death toll came from the city of coastal Manta alone, including 91 people who perished when a commercial building collapsed.

This Ecuador earthquake was especially damaging for several reasons. Buildings experience more shaking when they’re resting on soft sediments rather than bedrock, and many cities (including those in Ecuador) are built on sediments simply because that’s where terrain is flattest, and they are built on river outwash plains and coastal estuaries. Another issue experienced in some parts of Ecuador was soil liquefaction (http://temblor.net/earthquake-insights/ecuador-555/). Finally, the building construction quality plays a huge role in determining whether a structure will hold up during an earthquake. Unfortunately, buildings in Ecuador are often built with unsound materials including brittle masonry ‘infill walls’ and flexible reinforced concrete.
Now that we know where the rupture took place, and can examine three months of aftershocks as well as radar images of the ground deformation caused by the quake, we still believe that the 2016 earthquake overlapped or re-ruptured much of the 1942 earthquake. We say this with caution and humility, because in 1942, earthquake location accuracy was much poorer than it is today. In the figure below, we compare the rupture area of the 2016 earthquake (the colored grid) to that in 1942 (gray shaded area). The stars indicate the epicenters, the point where the earthquake rupture initiated.
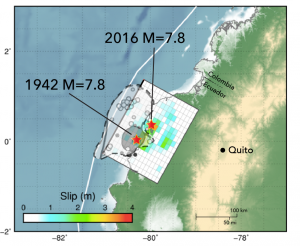
The best available data indicates that the 1942 and 2016 earthquakes ruptured nearly the same area, with the region of greatest slip slightly to the north in the 2016 event. However, the best available data is not necessarily good data, so it’s hard to tell the extent to which these events overlapped or not. The small circles are 1942 aftershocks from Jennifer Swenson and Susan Beck (1996). They are very widely distributed, some of which could be a mirage due to location uncertainty.
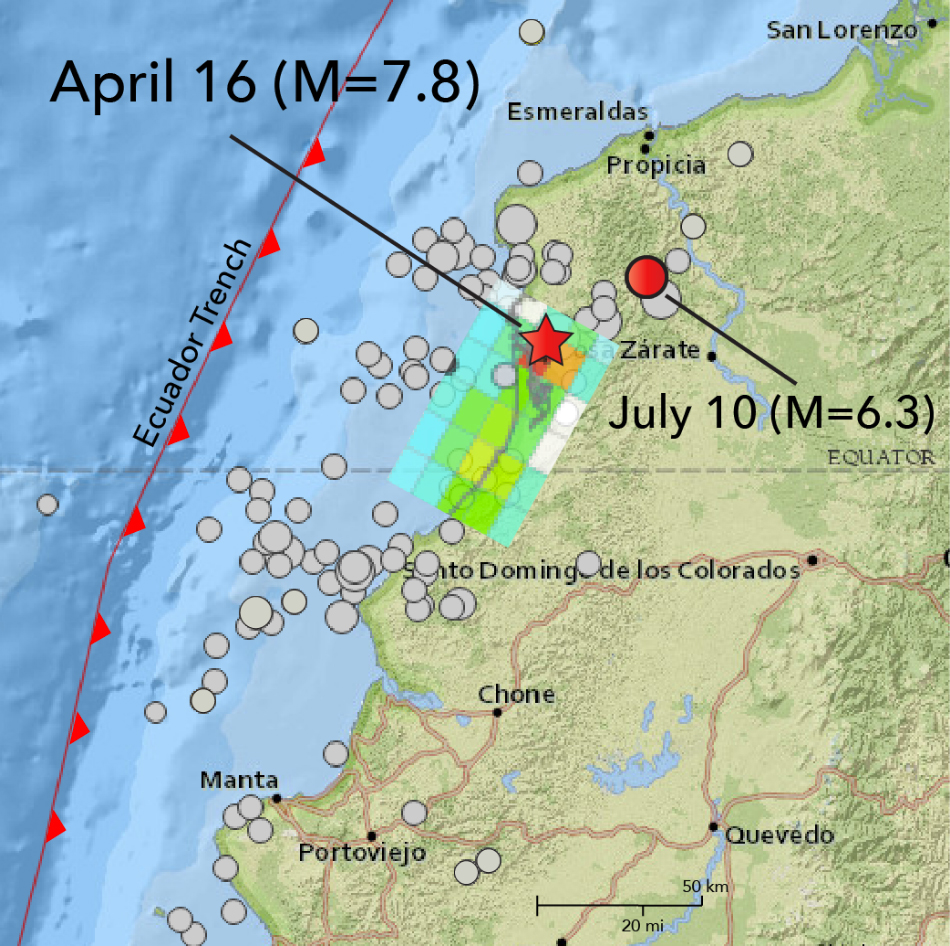
The distribution of shaking in 1942 and 2016 is also quite similar. Radar ground deformation imagery processed by Xu and Sandwell (2016) and Chaparro (2016) are consistent with the location of the rupture we show in the figure, and further show that the strike slip fault running roughly parallel to the coastline did not budge. Aftershocks follow mainshocks at rapidly decaying frequency but not magnitude. So, the damaging 10 July M=6.3 earthquake last week is not unusual, and large ones could still strike during the next decade or so. M>3.5 aftershocks are shown as grey dots in the map below from the USGS, and are overlain by the slip distribution of the main shock from Gavin Hayes of the USGS. it’s remarkable is how widely distributed the aftershocks are, covering an area 4-5 times larger than the rupture itself. This is likely due to the Coulomb stress transfer from the site that slipped to the surrounding sections of the subduction zone, which were brought closer to failure. You can also see that Manta, where the damage was greatest, lies 175 km (110 mi) to the south of the epicenter, a very long distance to incur such damage.
Could the fault have accumulated enough stress since 1942 to re-rupture in 2016?
The answer to this one is easy: Yes. Over time, the fault slips at about 60 mm/yr, so since 1942 about 4.5 m of slip would have accumulated. Given the rupture dimensions of about 45 km by 55 km, this amounts to a M=7.6 event, smaller but not much smaller than the 2016 event.
What does this all mean for future Ecuador earthquake risk?
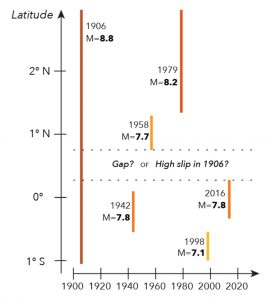
Of course, it’s impossible to know for sure. Before the 2016 quake, Chlieh et al. (2014) pointed to a possible gap in the seismic record since the 1906 M~8.8 earthquake that ruptured across the whole region and caused a large tsunami. The gap, if it exists, would lie between the 1942 M=7.8 event and the 1958 M=7.7 event. We should also be very circumspect about seismic gaps; they have failed most scientific tests, and so may fall in the realm of a “zombie hypothesis:” one that keeps on going even though it’s dead.
Do we have a seismic gap off the coast of Ecuador?
As shown above, the 2016 M=7.8 earthquake may have cut slightly into a gap of large quakes since 1906, although not enough to preclude a fairly large earthquake in that region. Still, it’s possible that our seismic gap is a phantom. Swenson and Beck (1996) suggested that the rupture zone of the 1942 earthquake abutted that of the 1958 event. Another possibility is that the 1906 slip was higher in the gap than elsewhere, so that it would take more time for sufficient stress to accumulate there. Even though this figure oversimplifies things, it nevertheless shows that exact repeats of quakes are exceedingly rare. A more durable expectation is that, given enough time, for every M=8.8 quake there should be about ten M=7.8 events, and so more large shocks are likely in the decades ahead.
Sources: USGS, EERI, and:
Chaparro, Thomas (2016), Application of InSAR to observe coseismic ground deformation of the April 16th, 2016 Ecuador earthquake
Chlieh, M., P.A. Mothes, J.-M. Nocquet, P. Jarrin, P. Charvis, D. Cisneros, Y. Font, J.-Y. Collot, J.-C. Villegas-Lanza, F. Rolandone, M. Vallée, M. Regnier, M. Segovia, X. Martin, H. Yepes (2014), Distribution of discrete seismic asperities and aseismic slip along the Ecuadorian megathrust, Earth Planet. Sci. Letts., 400, 292-301,
Mei Kuen Liu, Forell/Elsesser Engineers, 15 Jul 2016 EERI Ecuador Earthquake Reconnaissance Briefing Webinar.
Swenson, Jennifer L, and Susan L. Beck (1996), Historical 1942 Ecuador and 1942 Peru subduction earthquakes and earthquake cycles along Colombia-Ecuador and Peru subduction segments, Pure Appl. Geophys., 146, 67-101, doi: 10.1007/BF00876670
Xu, Xiaohua, and Sandwell, David (2016), Mw 7.8 Ecuador Earthquake: Line of sight displacement and the down-dip rupture revealed by ALOS-2 and Sentinel-1A Interferometry
- Earthquake science illuminates landslide behavior - June 13, 2025
- Destruction and Transformation: Lessons learned from the 2015 Gorkha, Nepal, earthquake - April 25, 2025
- Knock, knock, knocking on your door – the Julian earthquake in southern California issues reminder to be prepared - April 24, 2025