The quake produced severe shaking in a lightly populated area, brought the southern tip of the Cascadia Subduction Zone slightly closer to failure, and modestly inhibited rupture on the San Andreas Fault.
By Ross S. Stein, Ph.D., Temblor, Inc., Shinji Toda, Ph.D., Tohoku University, Chris Rollins, Ph.D., GNS Science New Zealand, and Volkan Sevilgen, M.Sc., Temblor, Inc.
Citation: Stein, R. S., Toda, S., Rollins, C., and Sevilgen, V., 2023, December 2022 California earthquake ruptured unknown fault: an analysis, Temblor, http://doi.org/10.32858/temblor.294
At 2:34 a.m. local time on Dec. 20, 2022, a magnitude-6.4 earthquake hit Ferndale, Calif. Severe shaking lasted for 15 to 20 seconds, leading indirectly to the deaths of two people, extensive building and infrastructure damage, and power blackouts throughout the region. As geologists began to analyze the event, they found landslides and cracks in roads — but no signs of liquefaction or, intriguingly, an obvious rupture at the surface (California Geological Survey, 2022). The earthquake triggered an Earthquake Early Warning alert, issued by the U.S. Geological Survey (USGS). These alerts ideally provide several precious seconds of notice to those who could experience strong shaking. Whether advance warning reached those within about 28 miles (45 kilometers) from the epicenter (those who experienced strong shaking) is not yet clear.
Scientifically, the quake was not a surprise: According to the Temblor model, there’s a 5% chance that a magnitude-6.4 earthquake will occur once per year in this region. This hyperactive seismic region has the strongest “once-in-a-lifetime” quake that can be expected compared to anywhere in the United States (even Alaska!): magnitude 7.2. That quake has about a 1% chance of occurring per year. But the severe rupture of a hidden, unmapped fault in this seismically active region nevertheless raises concern over current hazard risk assessments and methods that are based on mapped faults.
Why is the Cape Mendocino area so seismically active?
Ferndale and the surrounding 60-by-60-mile (100-by-100-kilometer) area make up the most seismically active region of California, with one magnitude-6.4 or larger quake every decade, on average. Thankfully, it is not densely populated, and its residents and governments are well prepared for earthquakes.
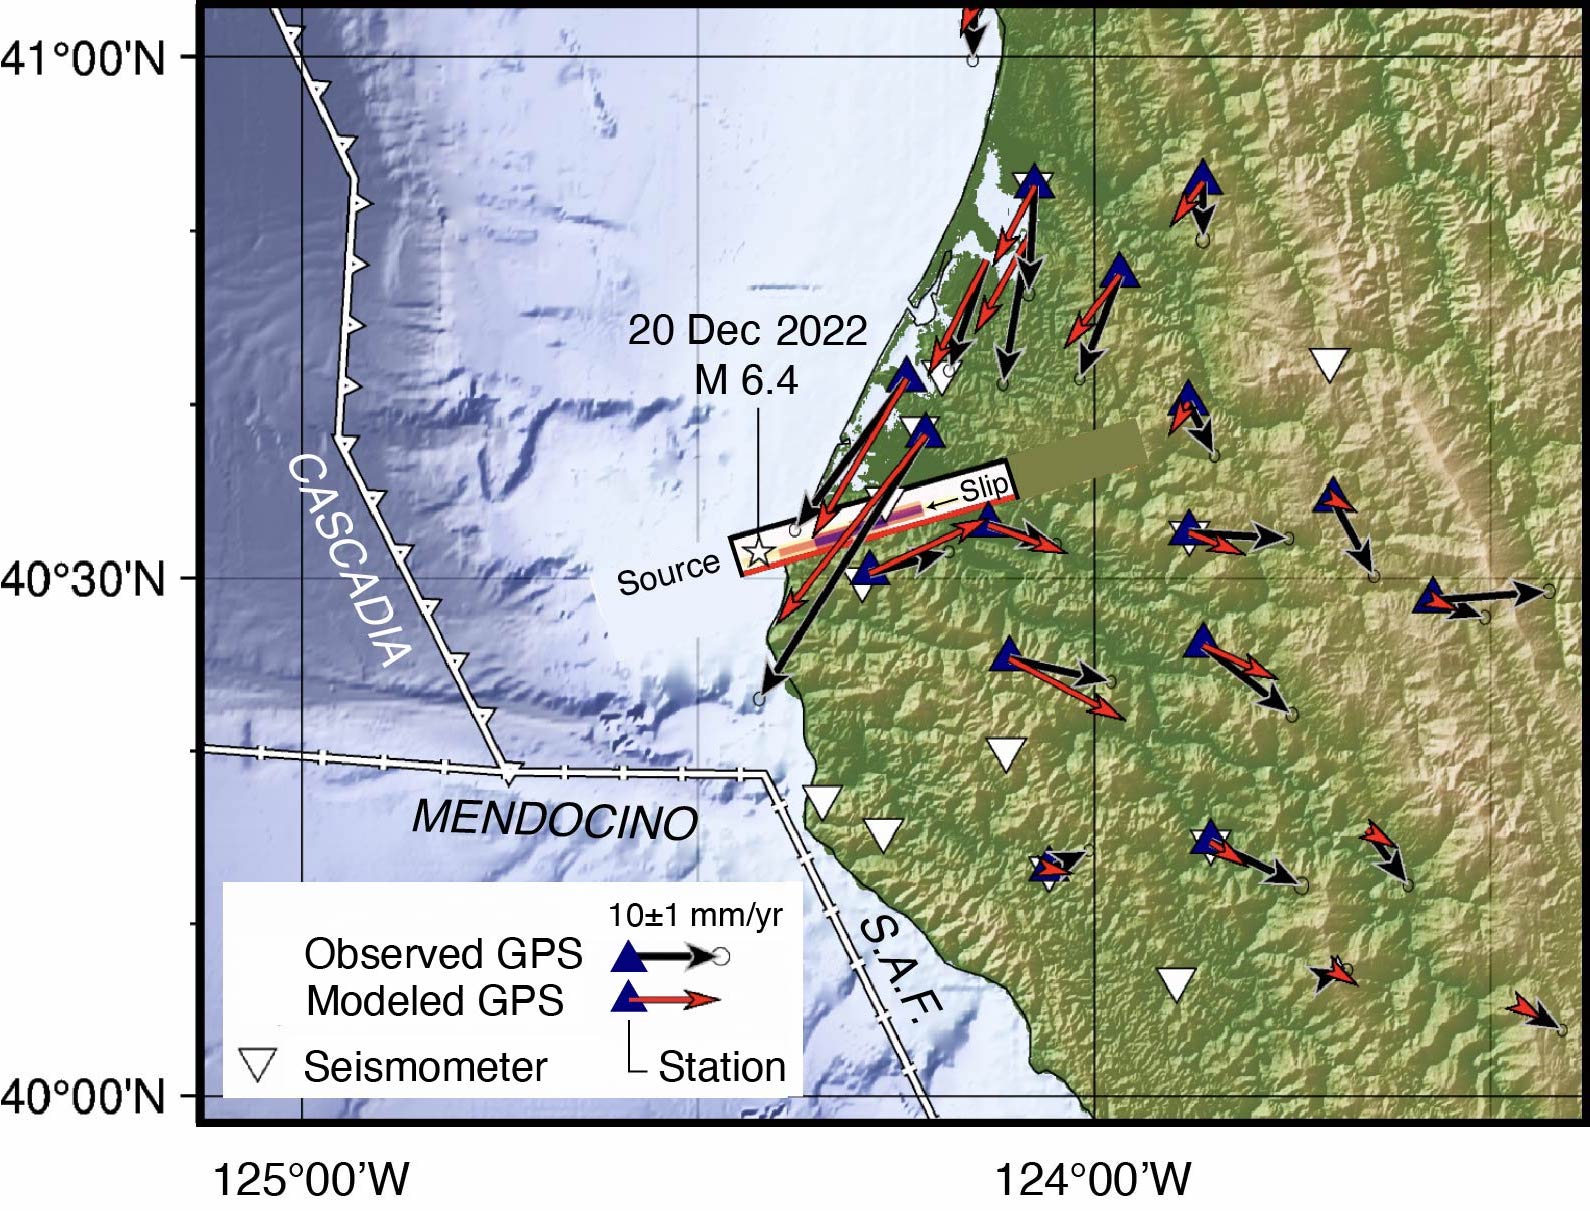
Ferndale sits atop a geologic “triple junction,” where three tectonic plates collide — in this case, the North American, Juan de Fuca, and Pacific Plates are colliding in the Mendocino Triple Junction, shown in the figure below. The collisions lead to Earth’s crust being compressed and stretched, and that distortion is exacerbated by two factors: the Juan de Fuca Plate subducting (sliding underneath) unevenly under the North American Plate, and the 80-degree bend the San Andreas Fault makes when it juts out into the Pacific. The Ferndale and surrounding Cape Mendocino areas are laced by faults.


The magnitude-6.4 quake struck on a northeast-trending left-lateral strike-slip fault, approximately 12 miles (20 kilometers) long. (Left-lateral means if you’re standing on one side of the fault, the other side appears to move to the left; right-lateral, like the San Andreas, is opposite.) The fault cuts across the grain of the mapped surface faults in this region, which are right-lateral and trend northwest (Kelsey and Carver, 1988; Clarke and Carver, 1992). The left-lateral fault probably does not extend to Earth’s surface, consistent with the apparent absence of surface rupture.

The inconsistency between the mapped faults and the likely fault that slipped in this quake underscores how difficult it is to assess seismic hazard on the basis of mapped faults — even in superbly mapped California.
Very strong shaking where people live
The magnitude-6.4 earthquake produced strong shaking and damage over an area of about 600 square miles (about 1,000 square kilometers). Recall that 1 g is the acceleration that we feel because of Earth’s gravity. In simplified terms, more than 1 g means you’re pushed down, whereas less than 1 g means you’re being pulled upward. If, on the freeway, you slam on the brakes of your car, you experience about 100% g, which is equal to 1 g. Roughly speaking, a peak ground acceleration greater than or equal to 20% g is delineated by the orange contour in the next figure.
Although not densely populated, homes and buildings are concentrated along the coastal plain near Eureka and along the Eel River Valley. Both are sites of young, unconsolidated (loose) sediments, in which severe shaking occurred. Seismic stations in those areas measured shaking of 30% to 140% g, whereas the three closest seismic stations to the epicenter and peak slip registered only between 12% and 26% g. This means shaking in the loose sediments was greatly amplified, despite being farther from the epicenter. For context, in California, buildings are typically susceptible to damage beginning around 10% g; damage becomes widespread at 20% g and severe at 50% g.

What could happen next?
Rollins and Stein (2010) argued that since the 1970s, earthquakes in the Mendocino Triple Junction have occurred in a kind of chain reaction in which each large quake transferred stress to the site of a subsequent event. The interactions are clear when compared to a control group in which the quakes were assumed to be independent of each other. But the myriad right-lateral, left-lateral and thrust faults in this area make anticipating the next quake very difficult. Nevertheless, we attempt to assess future possibilities.
The Dec. 20, 2022, magnitude-6.4 quake imparted stress to surrounding faults, which can act to promote or inhibit subsequent earthquakes. One approach is to resolve the Coulomb stress changes on the major nearby faults (left panels, next graphic). We find that failure is modestly promoted on a portion of the Cascadia megathrust, a 600-mile (1,000-kilometer)-long fault zone known for its seismic risk to the Pacific Northwest (top left). Failure is also promoted on a 15.5-miles-long (25-kilometer-long) section of the Mendocino Fault Zone near its junction with the San Andreas, and more strongly along a 15.5-mile-long (25-kilometer-long) section of California’s Little Salmon and Bear River Faults (bottom left).
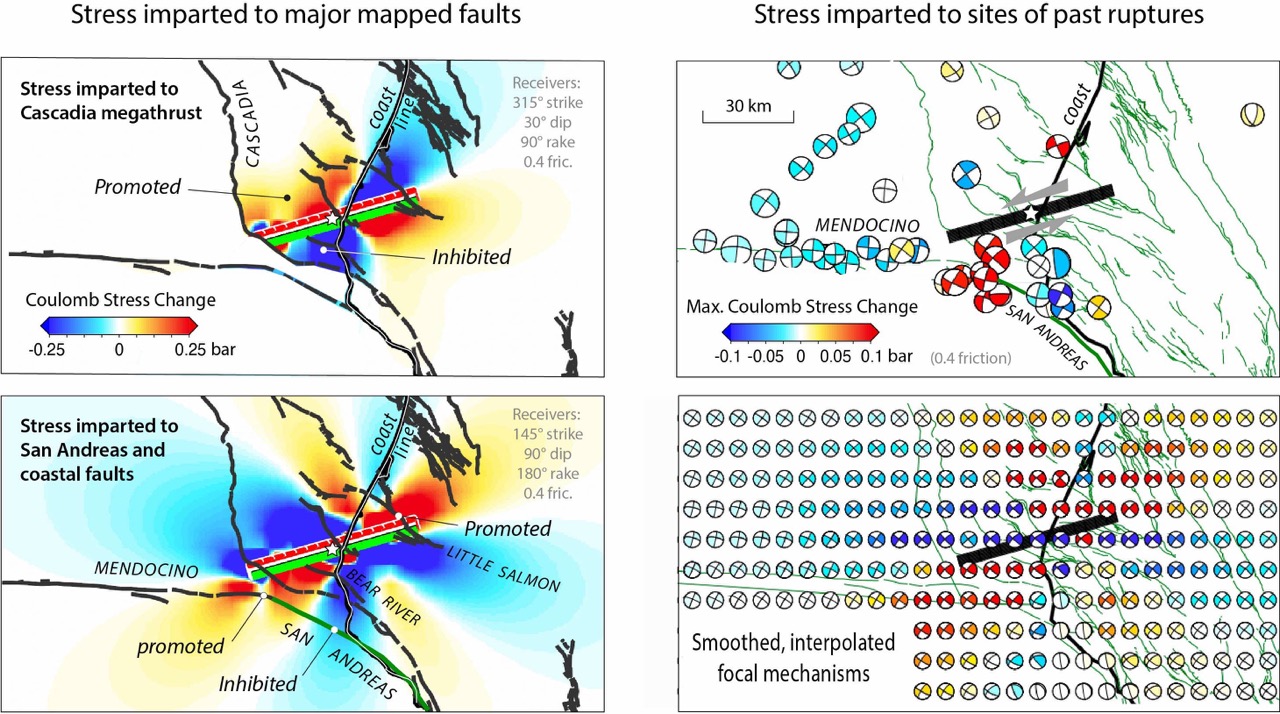
Another way to assess the stress changes is to resolve them on past earthquake focal mechanisms (the “beachballs” in the right panels, above). This calculation lends additional support to our inference that the easternmost Mendocino Fault was brought closer to failure, as were the Little Salmon Fault and the offshore portion of the Bear River Fault.
The Bottom Line
That the Ferndale earthquake occurred was not surprising scientifically, but it is surprising that the fault that ruptured bears no resemblance to the faults mapped at the surface. This is not good news for fault-based seismic hazard assessments. The last large quake in California, the 2019 magnitude-7.1 Ridgecrest quake, also ruptured a heretofore unknown fault (Toda and Stein, 2020). Both point to a potential weakness in seismic hazard assessment.
Looking ahead, there are several sections of right-lateral faults, including the Mendocino, Bear River and Little Salmon, that we calculate were brought slightly (about 0.3 bar) closer to failure by the Ferndale quake. A 186-square-mile (300-square-kilometer) section of the Cascadia megathrust fault was also brought closer to failure by about the same amount, and so these are possible sites for future quakes. But the good news is that the northern tip of the San Andreas is calculated to be inhibited (by about 0.25 bar) by the Ferndale rupture.
In short: It’s hard to know exactly how one earthquake will affect future quakes, but our analyses suggest the Ferndale quake could have made quakes along other small faults around the Mendocino Triple Junction slightly more likely. It also could have made a fault failure along the large Cascadia Subduction Zone slightly more likely. Rupture along the northernmost San Andreas Fault may be slightly less likely.
Acknowledgments. We thank Jay Patton of the California Geological Survey for sharing with us insights about the field reconnaissance.
References
California Geological Survey (2022), California Earthquake Clearinghouse:
https://learningfromearthquakes.org/2022-12-20-ferndale-ca/resources
Samuel H. Clarke, Jr., and Gary A. Carver (1992), Late Holocene tectonics and paleoseismicity, southern Cascadia Subduction Zone, Science, 255, 188-192, doi: 10.1126/science.255.5041.188
Harvey M. Kelsey and Gary A. Carver (1988). Late Neogene and Quaternary tectonics associated with northward growth of the San Andreas transform fault, Northern California, J. Geophys. Res., 93, 4797–4819. https://doi.org/10.1029/JB093iB05p04797
Carolyn P. Nuyen and David A. Schmidt (2022). Strain partitioning among forearc faults in southern Cascadia inferred from GNSS, J. Geophys. Res., 127, e2022JB024236. https://doi. org/10.1029/2022JB024236.
John C. Rollins and Ross S. Stein (2010), Coulomb stress interactions among M ≥ 5.9 earthquakes in the Gorda deformation zone and on the Mendocino Fault Zone, Cascadia subduction zone, and northern San Andreas Fault, J. Geophys. Res., 115, doi:10.1029/2009JB007117.
Shinji Toda and Ross S. Stein (2020), Long- and short-term stress interaction of the 2019 Ridgecrest sequence and Coulomb-based earthquake forecasts, Bull. Seismol. Soc. Am., 110, 1765–1780, doi: 10.1785/0120200169.
Shinji Toda, Ross S. Stein, Volkan Sevilgen, and Jian Lin (2011), Coulomb 3.3 Graphic-rich deformation and stress-change software for earthquake, tectonic, and volcano research and teaching, U.S. Geological Survey Open-File Report 2011–1060, 63 p., https://temblor.net/coulomb/
U.S. Geological Survey Event Page, M 6.4 Ferndale Earthquake, https://earthquake.usgs.gov/earthquakes/eventpage/nc73821036/executive
- Venezuela’s doublet leaned toward Caracas - June 30, 2026
- Is Southern California’s Cajon Pass an ‘earthquake gate’ ready to open? - June 29, 2026
- Philippines magnitude 7.8 shock may have loaded the central Cotabato subduction zone - June 11, 2026