Ross Stein, Temblor
Take a look at the Chiapas M=8.1 and Puebla M=7.1 mainshocks in the GEAR (Global Earthquake Activity Rate) model of Bird et al. (2015) that is shown in the Temblor app.
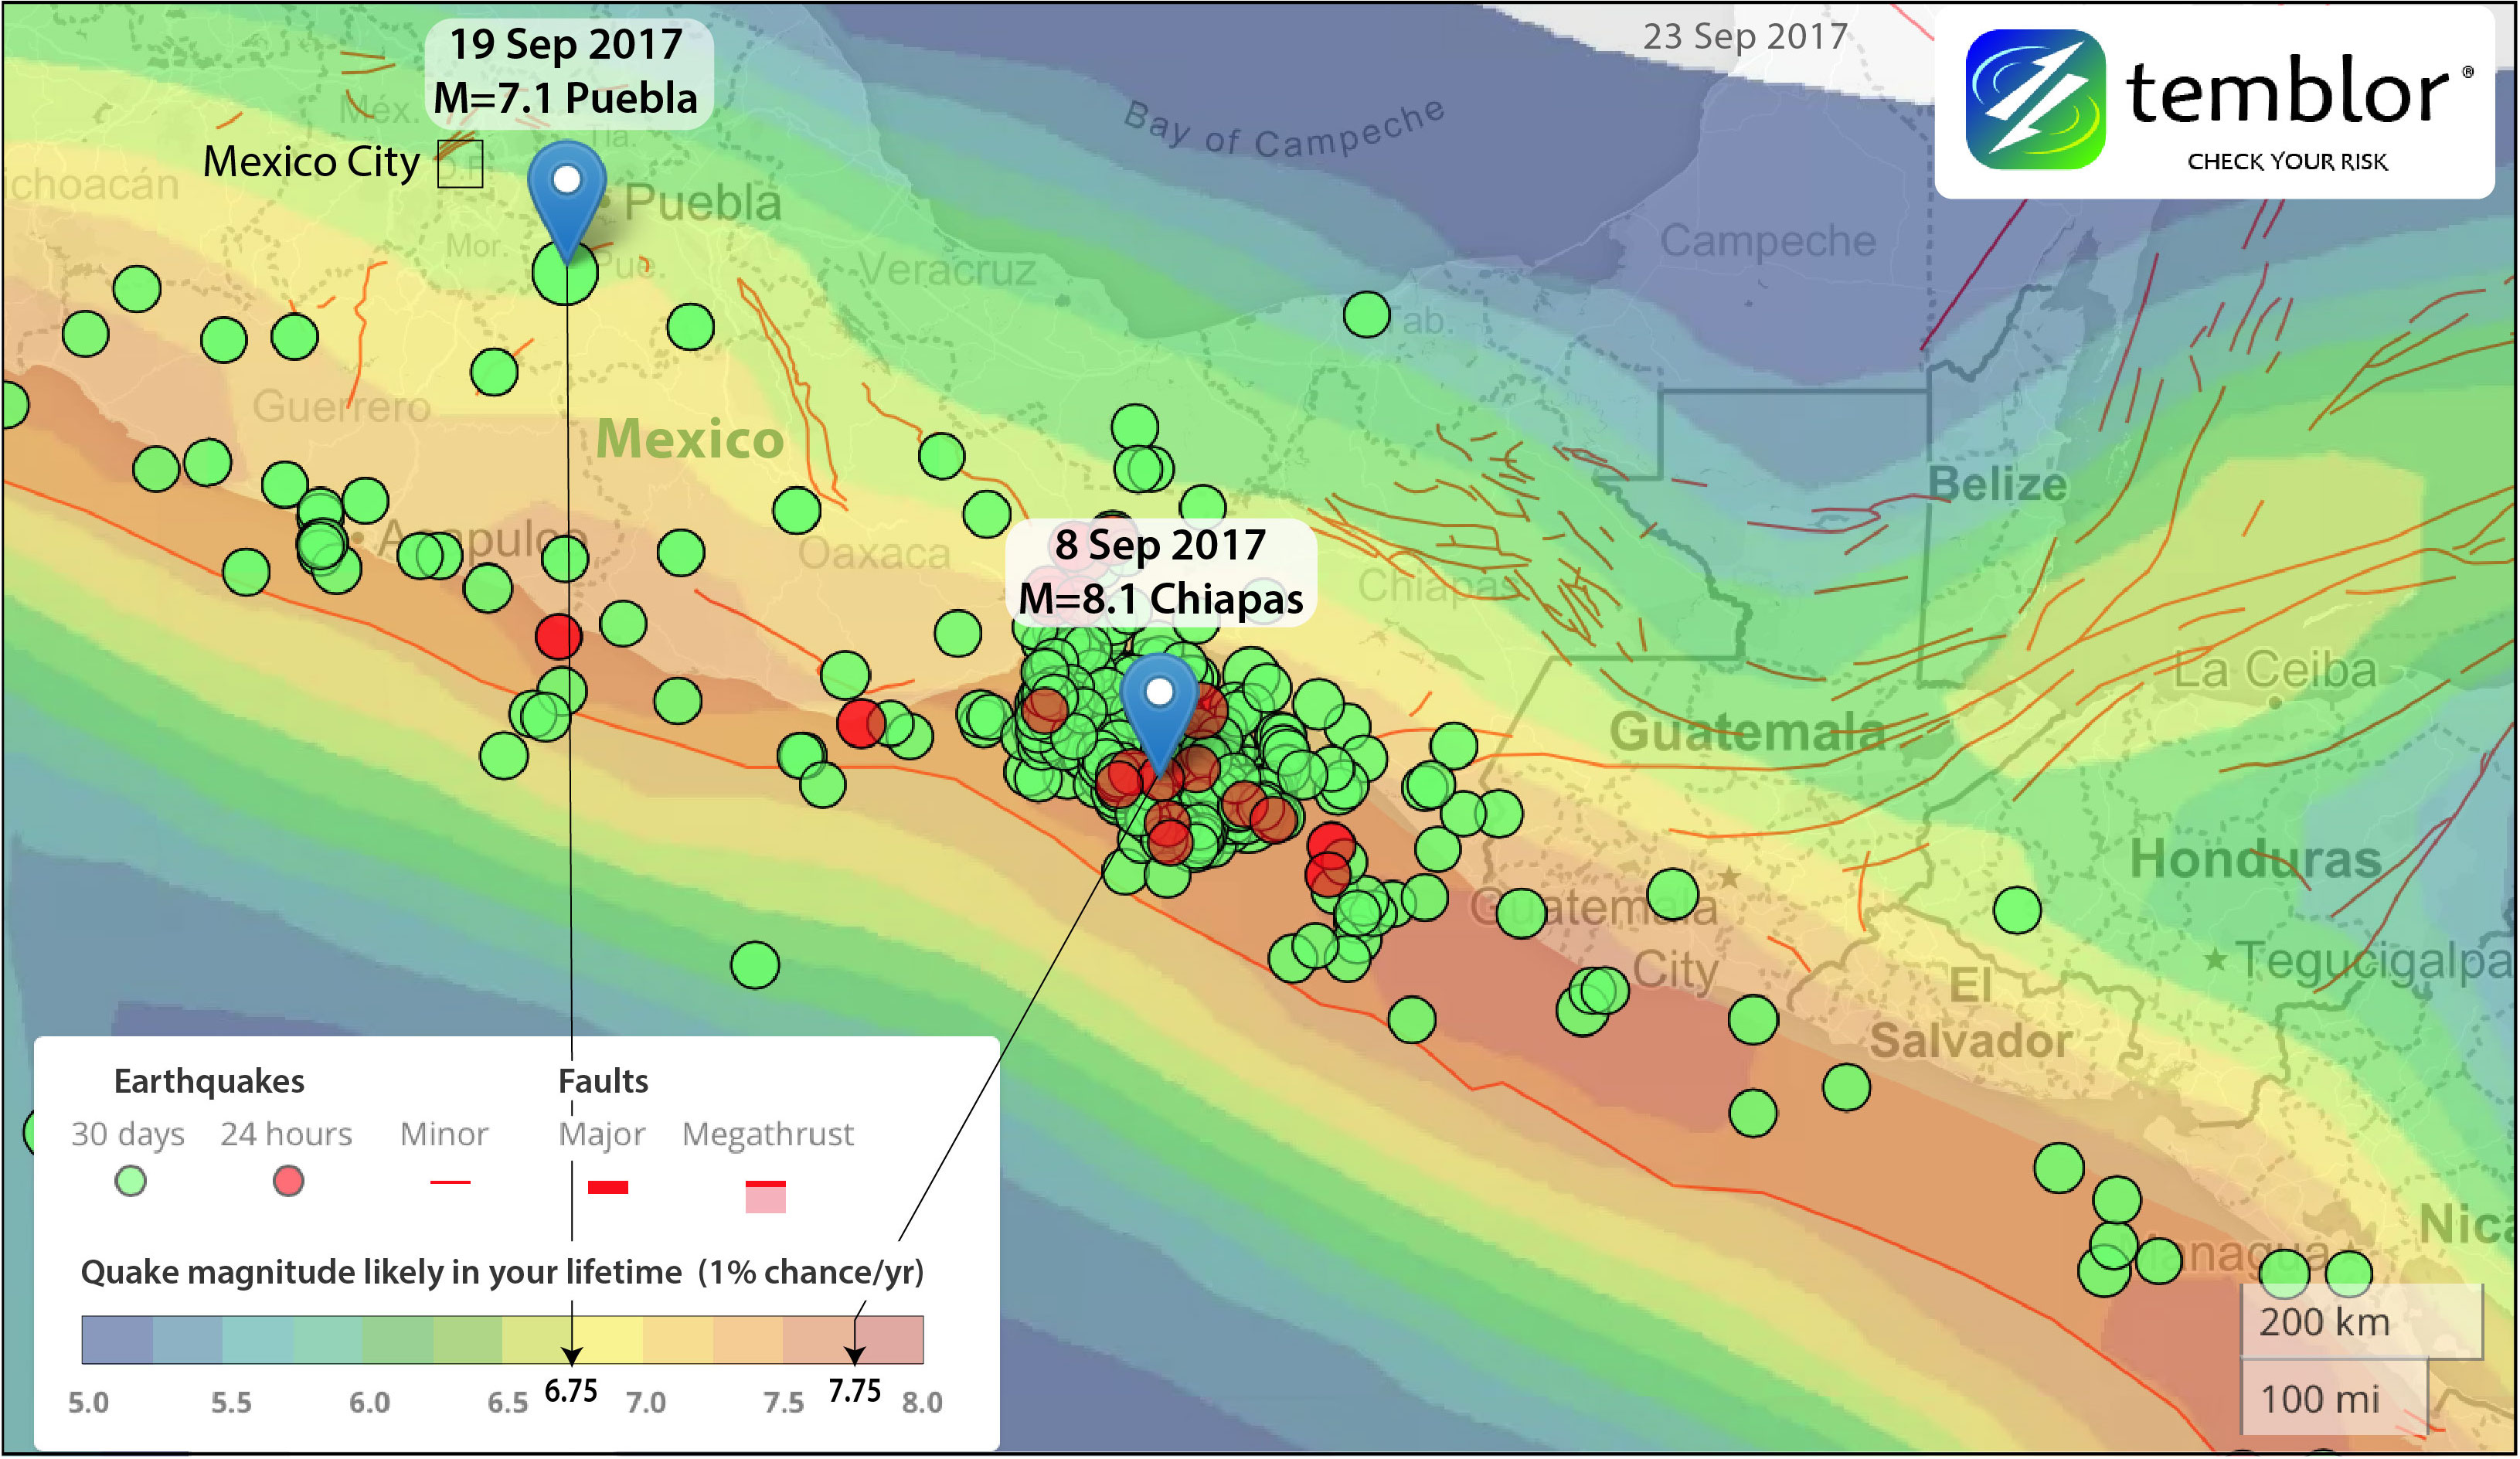
You can see that at the M=8.1 Chiapas epicenter, the quake likely in your lifetime is M~7.75; for the M=7.1 Puebla epicenter, it’s M~6.75. In both cases, the quakes we just experienced are a little larger than what one would expect in a lifetime, in other words, a little less likely than 1% per year. So let’s call the frequency of the M=8.1 and M=7.1 quakes about 0.5% per year. This means that neither can be considered very rare. By comparison, if your home is in the 1% per year zone in the U.S., flood insurance is mandatory if you have a mortgage.
What’s the chance these are independent events?
But wait a minute. Even though neither on their own is rare, what’s the chance that we would have independent M=8.1 and M=7.1 events just 11 days and 600 km apart? In other words, what’s the chance these two shocks had nothing whatsoever to do with each other? I calculate that to be 1 chance in 30,000 (1).
You might say, 1 chance in 30,000 is so remote that the two quakes must be related. You could be right, although we have not yet found a smoking gun (see our blog post on this: Are Mexico’s two major earthquakes related, and what could happen next?). If the seismicity near Puebla turned on immediately after the Chiapas mainshock, that would implicate the Chiapas M=8.1 as the culprit for Puebla (Tape et al., 2013; Johnson and Bürgmann, 2016). But that test is hampered by the fact that, by our estimate, most M<4 shocks go undetected by the Mexican Seismic Network. If this were Japan (which is complete to M<1), we would have 1,000 times the quakes to ask the question, and so in Mexico we are running a bit blind.
If not a coincidence, how could they be related?
One idea, suggested by Prof. Emily Brodsky at UC Santa Cruz, is if there were a widespread creep event after the first quake that transferred stress over this 600-km-long distance to the fault that ruptured in the second. Still another possibility is that the descending Cocos tectonic plate suffered a sudden bending event or downwarp, with both quakes just a sideshow of that process. Only by examining the motions of continuously recording GPS receivers in Mexico, or satellite (interferometric) radar imagery, can these speculations be tested, but in both cases the envisioned process would be so huge as to be unprecedented. Speculation nevertheless has a place in science; it keeps us from being small-minded.
But there’s another coincidence in our midst
Before you decide that 1 in 30,000 is too small a number to regard the quake pairing as a coincidence, consider this: What’s the chance that the M=7.1 Puebla shock would strike within 2 hours of the annual Mexico City earthquake drill? That has to be a coincidence, right? And this mattered: The good news was that people had just trained, but the bad news is that some confused the actual warning for a drill. It’s 1 chance in a 900,000, almost one in a million (2).
So, extreme coincidences do indeed occur in our lives, and after all the dust settles, we might find that it’s the best explanation we’ve got.
Notes
( 1 ) Multiply the annual frequencies of the two earthquakes at their locations, or 0.005 x 0.005, and then multiply by the ratio, 11/365 days, to get their independent rate over an 11-day span. GEAR as portrayed in Temblor uses disks of 50 km radius, but the two events are 600 km apart, and so to land in the same disk, the disk radius would need to be 300 km. So, multiply the answer by their respective areas (3002/502). This gives 6 x 10⁻⁵, or flipping the number over, 1 chance in 33,760, which I round to 30,000.
( 2 ) Multiply the 0.005 annual frequency of the Puebla quake by 2 hr/365 day (2.3 x 10⁻⁴), and one gets 1.7 x 10⁻⁶, or 1 chance in 876,000, which I round to 900,000.
( 3 ) Here’s a cautionary warning from Prof. David D. Jackson at UCLA about my estimates: “It is difficult to make a meaningful statement about the prior probability of something that has already happened [which is what I did in (1) and (2)]. However, a look to the future can lead to a meaningful statement, and we know that earthquake clustering in space and time does occur. One useful calculation would be to look in disks of 500, 600, and 700 km around earthquakes with magnitude about 8.1 in the entire global catalog, and find out how common M≥7 events are within increasing time windows.”
References
Bird, P., D.D. Jackson, Y.Y. Kagan, C. Kreemer, and R.S. Stein (2015), GEAR1: A Global Earthquake Activity Rate Model Constructed from Geodetic Strain Rates and Smoothed Seismicity, Bull. Seismol. Soc. Amer., 105, 2538–2554, doi: 10.1785/0120150058.
Johnson, C. W., and R. Bürgmann (2016), Delayed dynamic triggering: Local seismicity leading up to three remote M ≥ 6 aftershocks of the 11 April 2012 M8.6 Indian Ocean earthquake, J. Geophys. Res. 121, 134–151, doi:10.1002/2015JB012243.
Tape, C., M. West, V. Silwal, and N. Ruppert (2013), Earthquake nucleation and triggering on an optimally oriented fault, Earth Planet. Sci. Lett., 363, 231–241.
- Earthquake science illuminates landslide behavior - June 13, 2025
- Destruction and Transformation: Lessons learned from the 2015 Gorkha, Nepal, earthquake - April 25, 2025
- Knock, knock, knocking on your door – the Julian earthquake in southern California issues reminder to be prepared - April 24, 2025