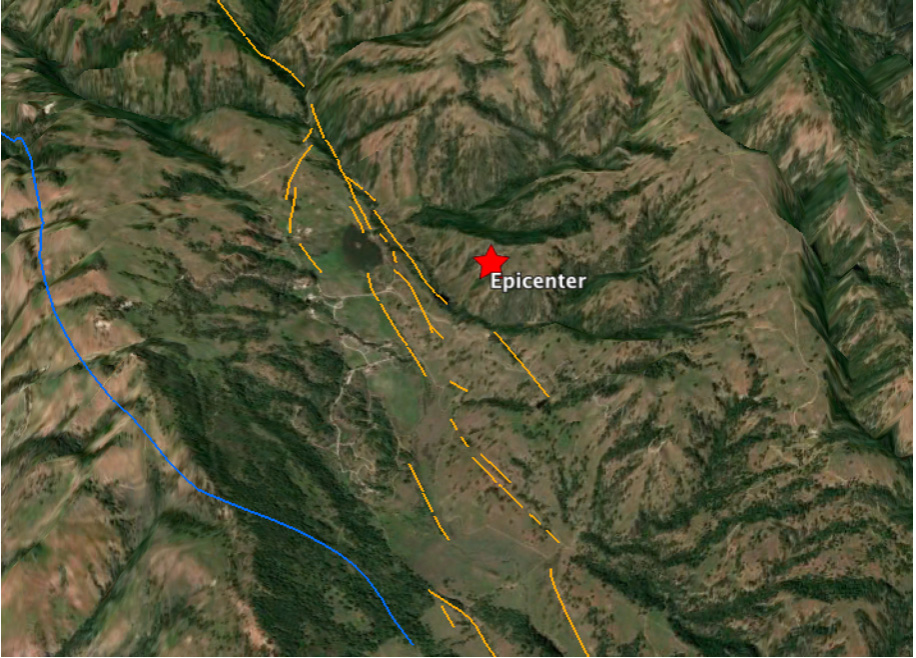
At the site of the cluster (the epicenter of the largest shock is shown as a red star), one sees a trough or depression along the fault and a range to the east. The Calaveras strands are orange, a much older fault is blue. We infer that the trough indicates that the fault has a jog or ‘echelon’ at this location: The southern branch perhaps lies on the west side of the trough, and the northern branch lies on the east side. Echelons like this create damage zones—sites of spalling and secondary fractures—that could be the site of the swarm. Google Earth image.
Latest posts by Temblor (see all)
- Earthquake science illuminates landslide behavior - June 13, 2025
- Destruction and Transformation: Lessons learned from the 2015 Gorkha, Nepal, earthquake - April 25, 2025
- Knock, knock, knocking on your door – the Julian earthquake in southern California issues reminder to be prepared - April 24, 2025