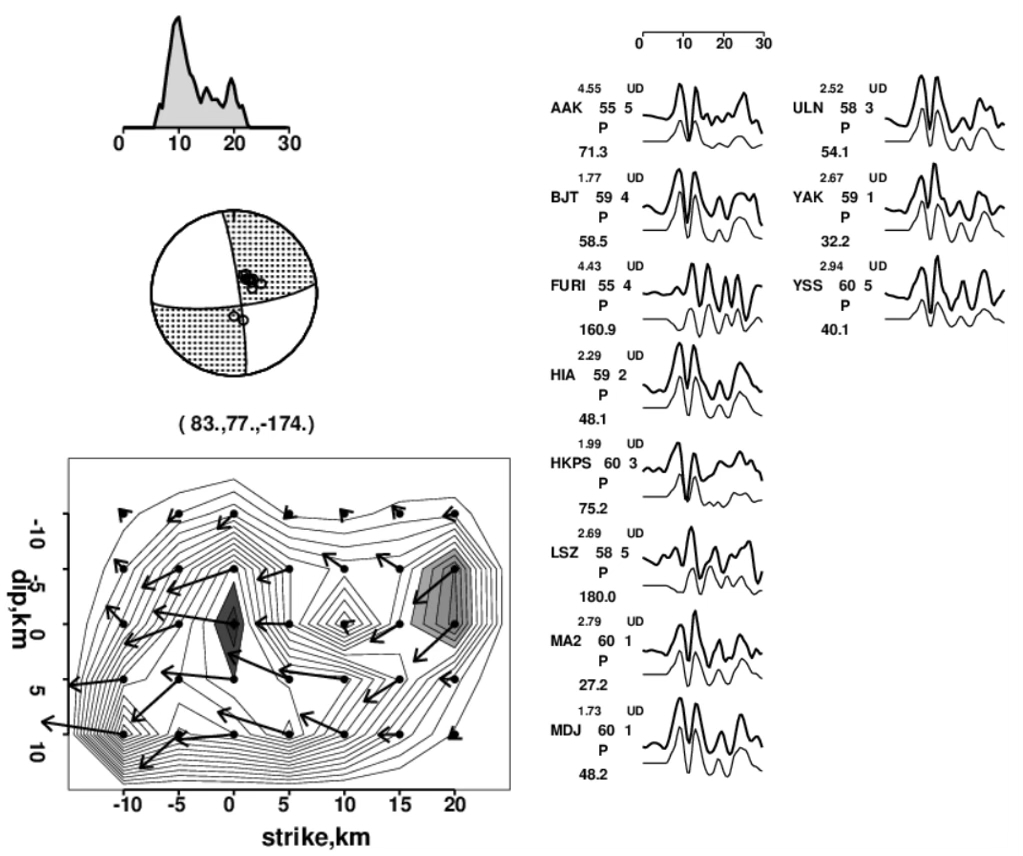
Figure 4. A slip distribution model for the April 23, 2025 magnitude 6.2 earthquake. The moment rate function is shown in the upper left corner of the figure. The arrows in the lower left denote the fault motion direction of the hanging wall; the arrow sizes are proportional to the slip amount derived for each grid cell. The waveform fitting between the observed and calculated seismograms is shown on the right. Credit: Erdik et al., 2025, CC BY-NC-ND 4.0
Alka Tripathy-Lang is a freelance science writer based in Chandler, Arizona, and holds a Ph.D. in geoscience.
Latest posts by Alka Tripathy-Lang, Ph.D. (see all)
- Living through the Loma Prieta earthquake - October 21, 2021
- The Great Quake Debate: an interview with seismologist and author Susan Hough - August 27, 2020
- Salton Sea Swarm quiets down - August 12, 2020