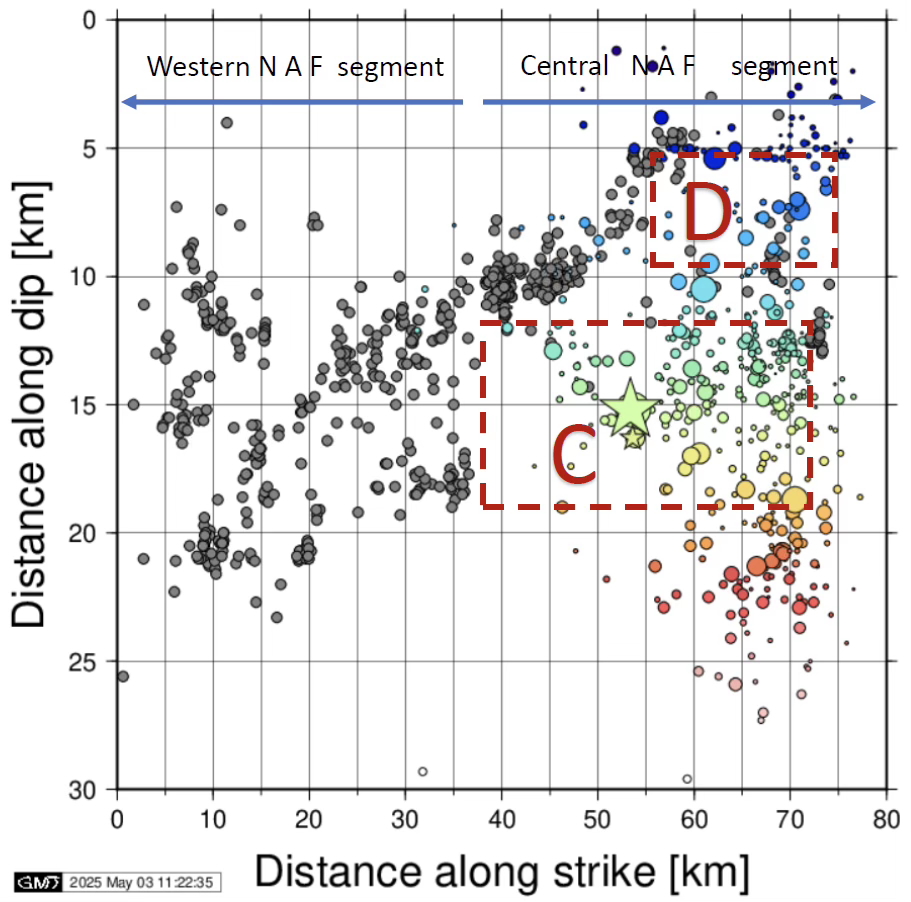
Figure 3. The depth cross-section of the aftershocks along the fault segment (as shown in Figure 2). The hypocentral depths of the foreshock that occurred 36 minutes prior, and the mainshock, are marked by small and large star symbols, respectively. Note that the foreshock is located just beneath the hypocenter. The gray dots show the seismic activity published in Yamamoto et al. (2017). Credit: Erdik et al., 2025, CC BY-NC-ND 4.0
Alka Tripathy-Lang is a freelance science writer based in Chandler, Arizona, and holds a Ph.D. in geoscience.
Latest posts by Alka Tripathy-Lang, Ph.D. (see all)
- Living through the Loma Prieta earthquake - October 21, 2021
- The Great Quake Debate: an interview with seismologist and author Susan Hough - August 27, 2020
- Salton Sea Swarm quiets down - August 12, 2020