Megathrust earthquakes have caused some of the most devastating natural disasters in history, but a new model could improve our ability to forecast them.
By Jessica Orwig, Ph.D., Science Writer
Citation: Orwig, J., 2021, A better way to forecast megathrust earthquakes and subsequent tsunami events, Temblor, http://doi.org/10.32858/temblor.180
The costliest natural disaster in history happened in 2011 when a megathrust earthquake struck off the coast of Japan, triggering the 2011 Tohoku earthquake and tsunami. The events resulted in nearly 20,000 deaths and cost an estimated $220 billion USD in damages.
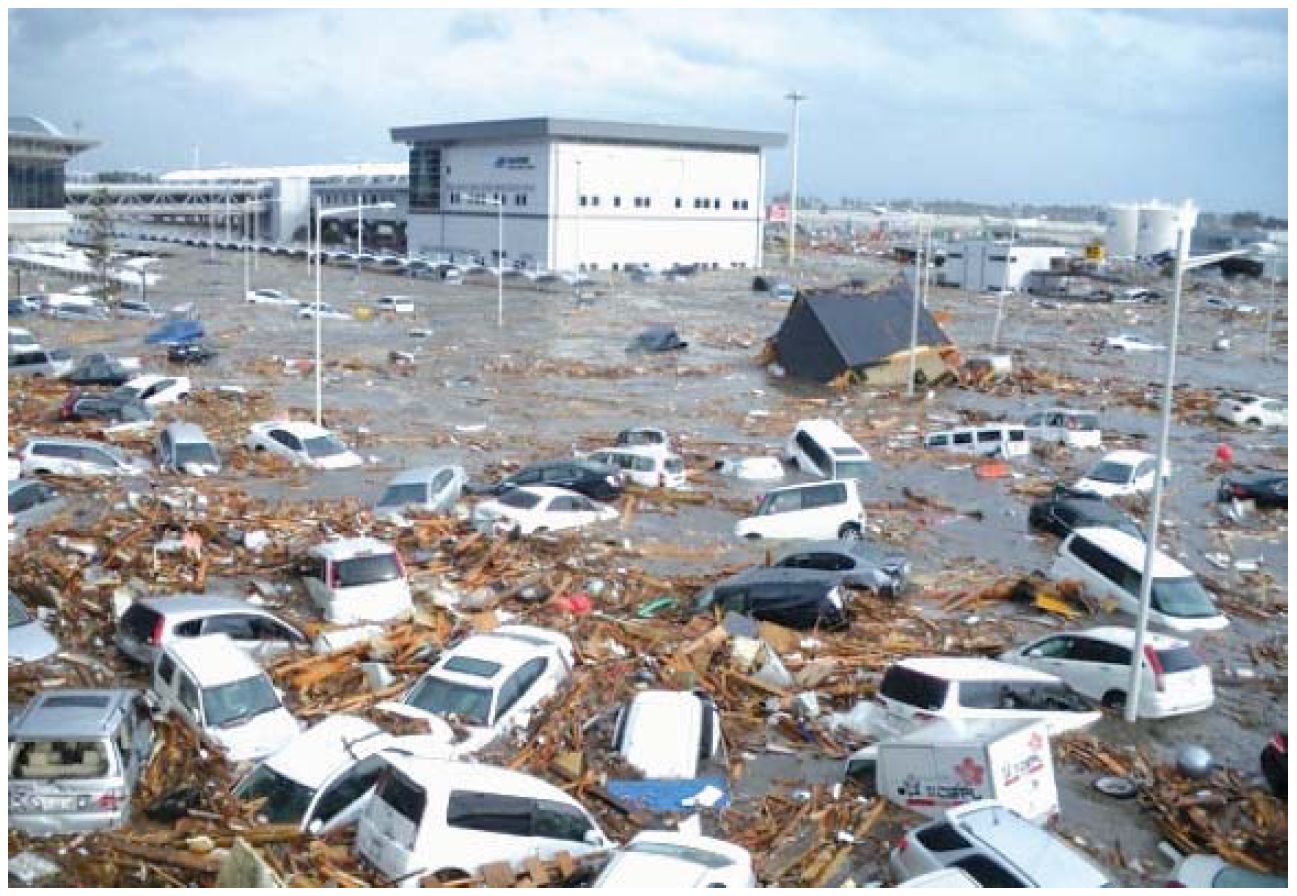
Megathrust earthquakes are some of the most destructive forces of nature on the planet because they occur underwater. When such massive faults move, they displace water, generating powerful tsunamis that can devastate entire cities. In the case of the Tohoku earthquake, the tsunami inundated areas up to 130 feet (40 meters) above sea level.
The fact that megathrust earthquakes happen miles offshore also makes them difficult to monitor. This means that, in the past, researchers have had to make assumptions in their forecasting models that may have led to misleading results, according to new research published in Nature Geoscience. In this latest work, a different model suggests that the risk from megathrust earthquakes is higher than previously thought.
How to forecast a megathrust earthquake
Megathrust earthquakes are extremely powerful seismic events triggered in subduction zones, where one tectonic plate plunges below another. When plates collide like this, it produces a slow shift in the ground — usually a few centimeters per year.
Normally, researchers can monitor impending earthquakes by using GPS instruments to track these subtle movements. How quickly the ground moves is an indication of how fast the plates are slipping.

Researchers then compare this slip rate to the long-term motion of the two plates, giving an indication of the slip deficit accruing on the fault. A large slip deficit indicates significant stress accumulating within the surrounding plates, and therefore a more unstable fault that’s at higher risk of an earthquake.
But because megathrust earthquakes happen offshore where you can’t just install GPS sensors, monitoring the seafloor is more difficult and expensive. In most parts of the world, the seafloor-monitoring systems researchers need either do not exist or are too sparse to monitor the whole fault zone effectively. As a result of insufficient seafloor-monitoring systems, researchers have relied on alternative methods like taking seafloor samples to study the type of rocks along these subduction zones to determine their physical properties, which can shed light on slip rate and earthquake behavior.
Laboratory studies of seafloor samples from places like Japan, Ecuador, and the Cascadia Subduction Zone indicate that the faults are stable and slipping freely — meaning the faults are building minimal stress. This has led past models to assume a slip deficit of zero, suggesting a low risk of megathrust earthquakes in these areas, says Eric Lindsey of the University of New Mexico and lead author of the new study.
“The thing is that all of these models, they sometimes apply different boundary conditions and different constraints,” says Daniel Melnick of the Austral University of Chile who wasn’t involved in the new research. For example, some models are for areas that are not completely covered by land-based GPS stations and as a result, researchers assume a slip deficit of zero. “That’s a constraint that’s not necessarily true. The interpretation of the slip deficit map is not always straightforward [in past models],” Melnick says.
It takes two
In the new study, Lindsey, who led this research while at the Earth Observatory of Singapore, and his colleagues introduce a novel way of estimating slip deficit along subduction zones.
Typically, faults are described as lines on a map. But in three dimensions, the surface of these megathrusts extends hundreds of kilometers into the earth, often below land that sits above sea level. Lindsey’s team correlated data from two different parts of a megathrust fault: the shallower, underwater part — where megathrust-tsunami events occur — and the deeper part that is located under land. They tested the model according to data from the Japan Trench and the Cascadia Subduction Zone, and concluded that the slip deficit is higher than previously thought.
When the land-based deeper part of the fault is locked, or not moving — which scientists know because of land-based GPS instruments that measure movement — that part of the fault generates what Lindsey and the team call a “stress shadow” along the shallow part of the fault. Depending on factors like how long the deeper fault section has been locked, their model uses this stress shadow to calculate the slip deficit along the shallower, underwater part of the fault.

“That is why the Lindsey paper is so important — because [Lindsey and colleagues] provide a clear method of a theoretical concept of how to frame the slip deficit map of the shallow megathrust,” Melnick says. “I think it’s very important.”
Limitations
Lindsey says that a limit of the model is in areas where “the deeper fault is not locked or only partly locked, which means there is less of a stress shadow cast on the shallow part. In those areas, our model is not as effective in allowing us to resolve the shallow slip deficit.”
One area where this is the case is in the Cascadia Subduction Zone in southern Oregon, Lindsey says. “There is not as much deep locking on the fault, and consequently our model uncertainty is higher near the trench, in the shallow part of the fault.”

Where the team’s model can really make a difference is in places that generate the largest megathrust earthquakes like Tohoku, Lindsey says. That’s because these events “require deep locking, which means those areas will almost always have a high slip deficit near the trench.”
Why it matters
Accurate slip deficit estimates are important because “that slip deficit can be directly used to calculate the maximum magnitude of a forthcoming earthquake,” says Melnick.
“Say you have a slip deficit of one meter over an area of 100 square kilometers,” says Melnick, who is part of a team that’s measuring earthquake potential off the coast of South America. “That could be equivalent to a magnitude-7 earthquake because the seismic moment is equal to the area of the fault times the slip.”
Lindsey says that, in a perfect world, there would be a vast network of seafloor instruments that could easily monitor these shallow faults more directly. But in the meantime, he says most models in which researchers have assumed a slip deficit value of zero “should be reevaluated because those models might have been made with a faulty assumption.”
References
Lindsey, E.O., Mallick, R., Hubbard, J.A. et al. Slip rate deficit and earthquake potential on shallow megathrusts. Nat. Geosci. 14, 321–326 (2021). https://doi.org/10.1038/s41561-021-00736-x
- Venezuela’s doublet leaned toward Caracas - June 30, 2026
- Is Southern California’s Cajon Pass an ‘earthquake gate’ ready to open? - June 29, 2026
- Philippines magnitude 7.8 shock may have loaded the central Cotabato subduction zone - June 11, 2026