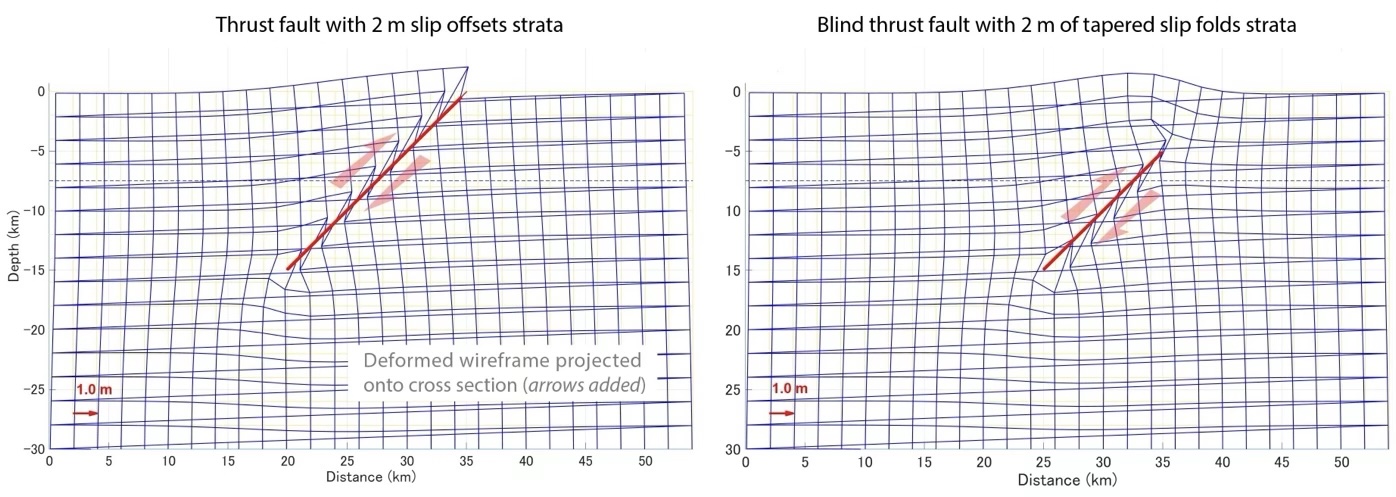
Figure 2. A deformed wireframe illustrates surface folding associated with a thrust fault. On the left, the fault ruptures the surface. On the right, the fault does not reach the surface. The deformation shown in both panels has been exaggerated by a factor of 1,000 to show 2 kilometers of cumulative slip in an elastic medium. Poisson’s ratio has been changed from the 0.25 default to 0.5 so that volume is preserved. This makes cross-sections ‘retrodeformable,’ meaning the deformation can be undone and the strata restored, as generally assumed by geologists for the lithosphere. Credit: Temblor, CC BY-NC-ND 4.0
Alka Tripathy-Lang is a freelance science writer based in Chandler, Arizona, and holds a Ph.D. in geoscience.
Latest posts by Alka Tripathy-Lang, Ph.D. (see all)
- Living through the Loma Prieta earthquake - October 21, 2021
- The Great Quake Debate: an interview with seismologist and author Susan Hough - August 27, 2020
- Salton Sea Swarm quiets down - August 12, 2020