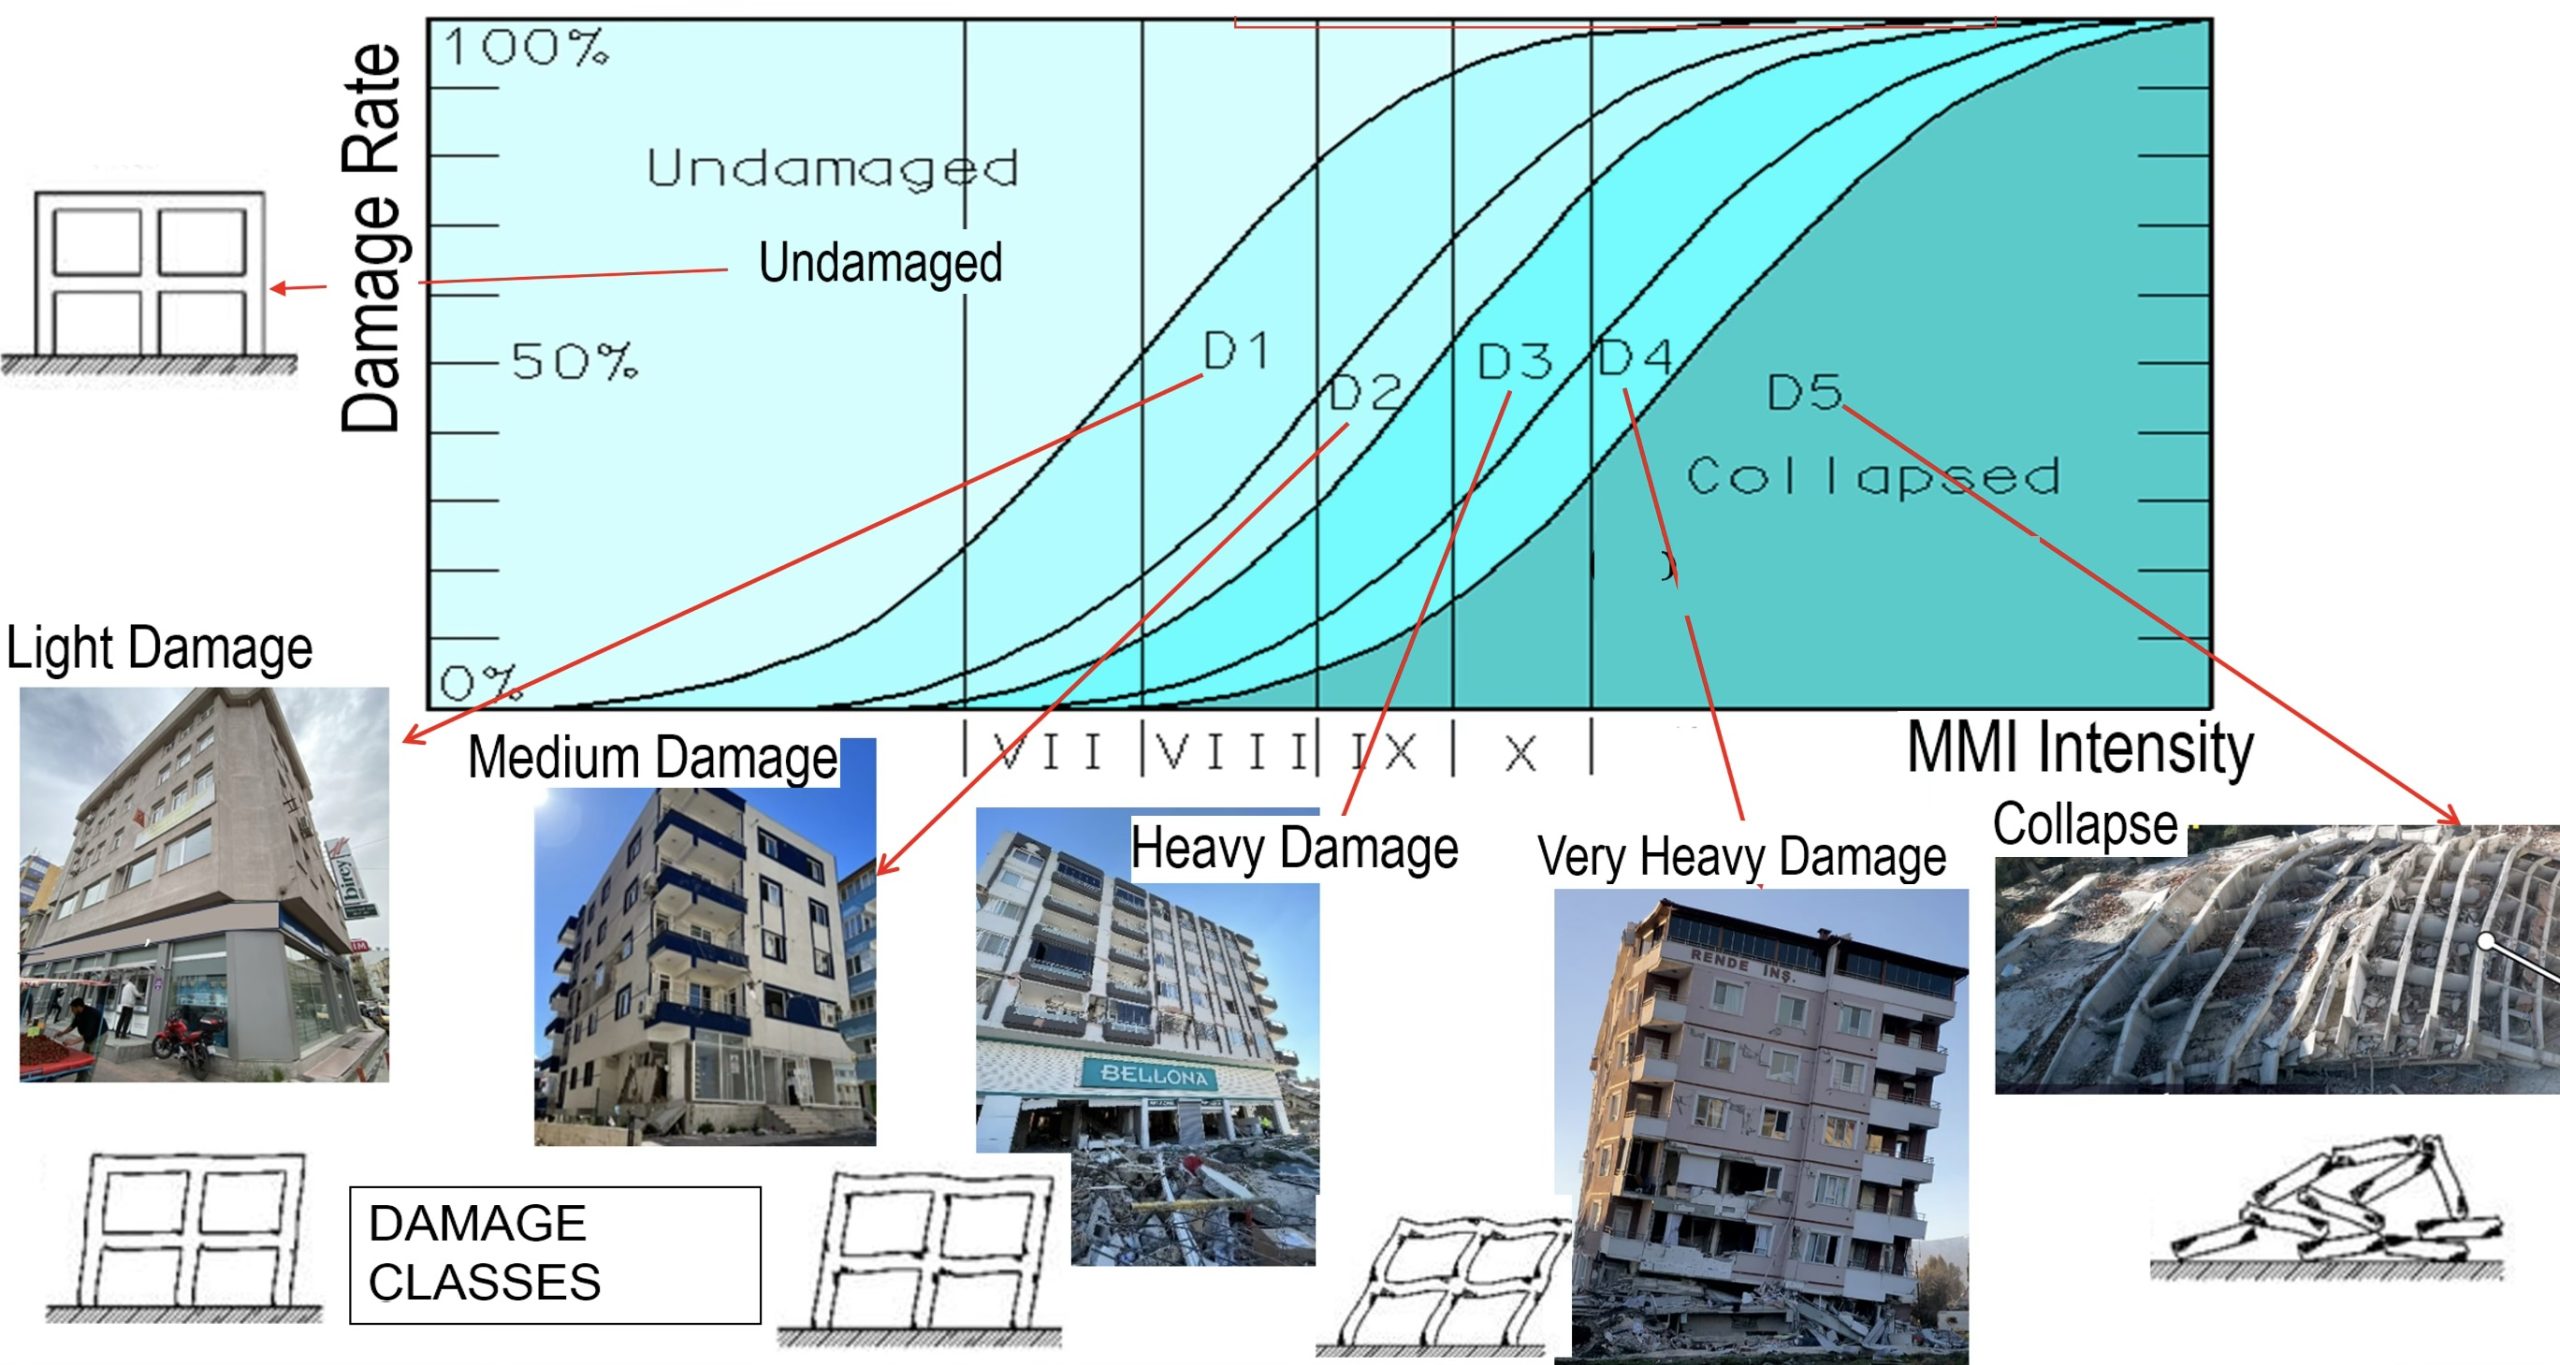
Figure 9. Fragility relationship for common mid-rise reinforced concrete buildings. The vertical axis indicates the percentage of buildings in defined damage states (labeled D1 to D5) for the MMI intensity range indicated on the horizontal axis. Credit: Erdik et al., 2025, CC BY-NC-ND 4.0
Alka Tripathy-Lang is a freelance science writer based in Chandler, Arizona, and holds a Ph.D. in geoscience.
Latest posts by Alka Tripathy-Lang, Ph.D. (see all)
- Living through the Loma Prieta earthquake - October 21, 2021
- The Great Quake Debate: an interview with seismologist and author Susan Hough - August 27, 2020
- Salton Sea Swarm quiets down - August 12, 2020