By David Jacobson, Temblor
Click here to read more about the M=6.9 Guatemala earthquake

Yesterday, we wrote about the M=6.9 earthquake in Guatemala near the border with Mexico. Today, we thought we’d take a closer look at the continuing seismicity both around the mainshock, and offshore near the Middle America Trench. While there have been 43 aftershocks (M>4.0) in close proximity to the M=6.9, according to the Mexican Seismological Service, which is not surprising given the quake’s size, there is also a streak of offshore seismicity that deserves greater attention.
This streak, which can be seen in the Temblor map below, is at least 75 km long, and oriented nearly parallel to the relative plate motion vector. First, it should be stated that seismicity streaks like this one are typical around the world and are often indicative of greater localized resistance on a fault surface. However, there are both temporal and spatial characteristics about this streak that should be highlighted.
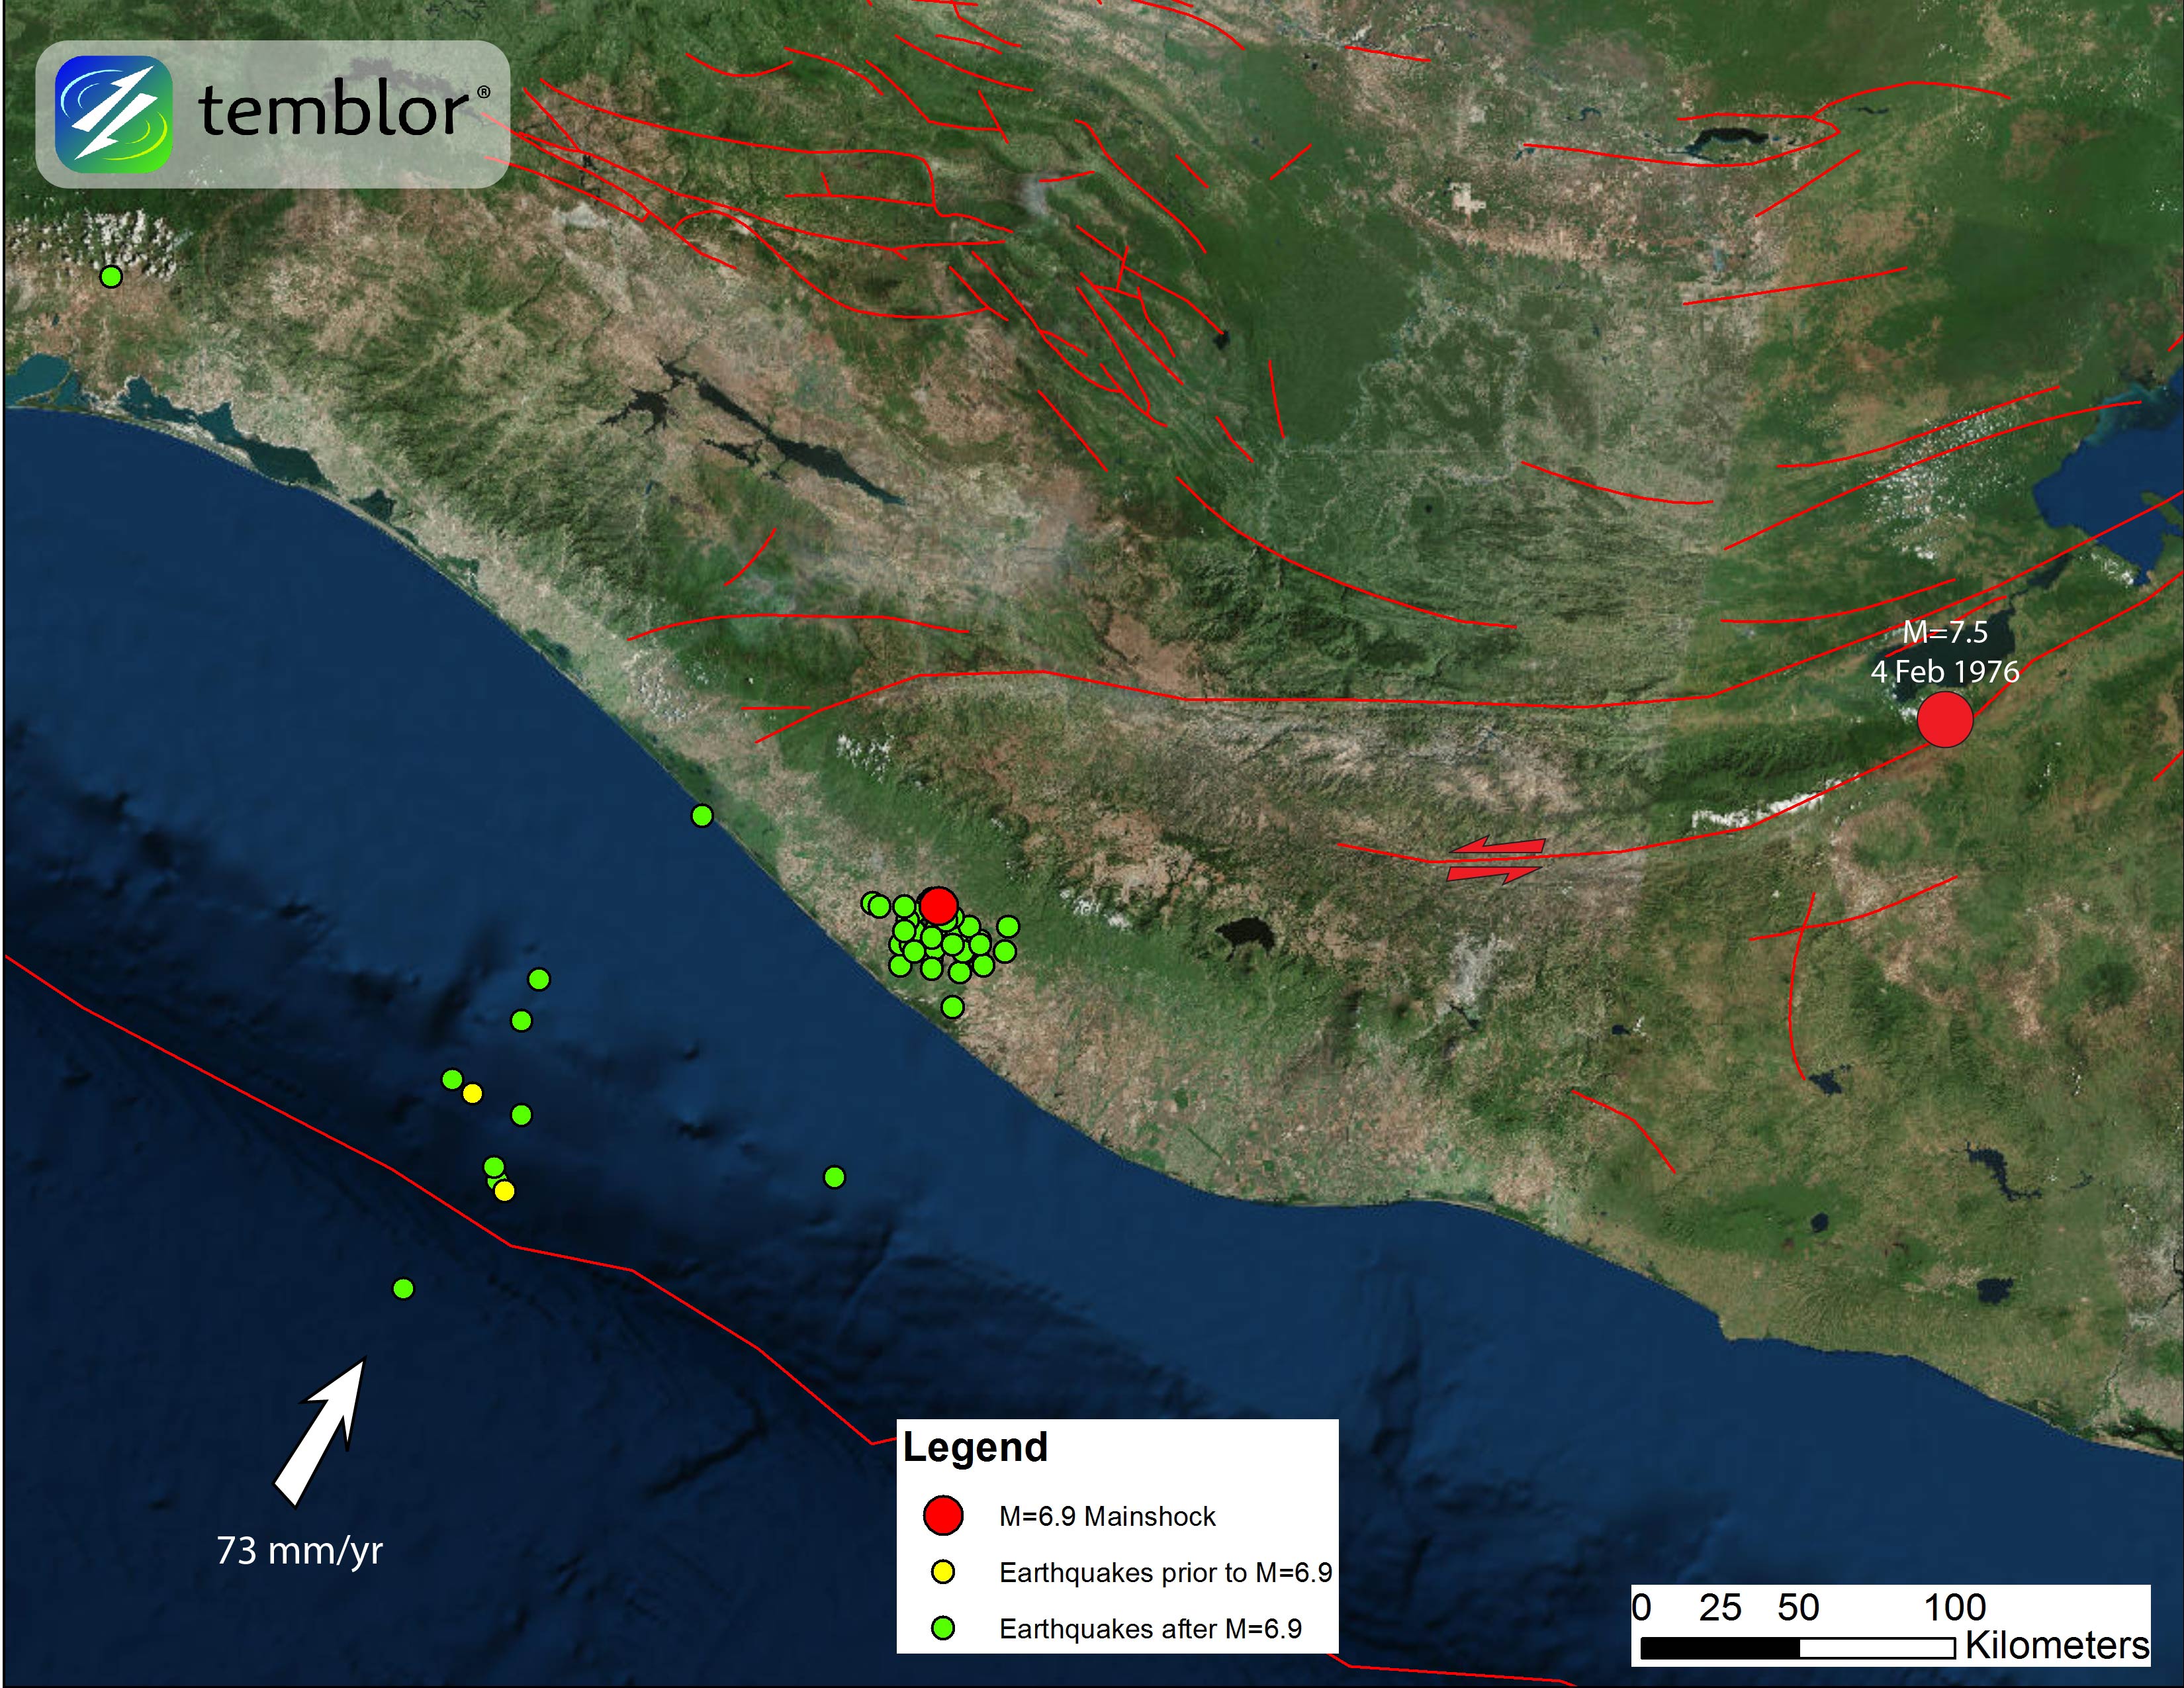
From the Temblor map above, one can see that in the day prior to the M=6.9 earthquake, there were only two offshore quakes (the earthquakes shown in the map are from the last two days). However, there have been seven M>4.0 earthquakes since. While it is true that this part of Central America is highly seismically active, a significant increase like this is eye-opening, and is either a remarkable coincidence, or it could suggest that the events are related. If they are related, it could be indicative of a larger slip event in the region.
In additional to this temporal characteristic, spatially, the streak is also curious. First, as was already mentioned, it is nearly parallel to the relative plate motion vector suggesting it could be subduction zone-related. However, it is also possible that it is loosely tied to the active triple junction Guatemala sits on. In the Temblor map, the left-lateral strike-slip Motagua Fault, on which the 1976 M=7.5 earthquake struck is clearly visible. Additionally, there is another large fault just to the north, which is nearly parallel to the Motagua Fault. Near the coast, this fault begins to trend to the southwest, and if projected offshore would track very close to the recent seismicity streak. While just a theory, it is possible that rather than being subduction zone-related, the streak is actually associated the active strike-slip boundary which runs through Guatemala. Based on the depths of the quakes either association seems possible, and in the absence of focal mechanisms this remains a theory. Nonetheless, it is a characteristic worth highlighting.
One of the reasons why bringing up these ideas is important is because this part of Central America is both highly seismically active and susceptible to experiencing large magnitude earthquakes. Additionally, while events like this do not necessarily precede large quake, they can, and if this entire area were to rupture, a M=7.5+ earthquake could result. Such an event would cause significant shaking along the coast and could trigger a deadly tsunami. Therefore, pointing out characteristics such as those shown here are important, as they can help people understand the seismic hazard of the region in which they live.
References
Mexican Seismological Service
USGS
- Earthquake science illuminates landslide behavior - June 13, 2025
- Destruction and Transformation: Lessons learned from the 2015 Gorkha, Nepal, earthquake - April 25, 2025
- Knock, knock, knocking on your door – the Julian earthquake in southern California issues reminder to be prepared - April 24, 2025