By Gabriel Lotto, Temblor
Rivers are beginning to recede after several days of devastating flooding in Louisiana. On Tuesday, we showed how FEMA’s flood maps did a pretty good job of predicting where flooding actually occurred. However, in many places floods exceeded even the predicted 0.2% chance per year water levels, making this week’s floods truly historic.
FEMA designs its flood maps by statistically analyzing past records of river flow, storm surges, and rainfall. This method assumes that the flood risk in the future is the same as it was in the past. But what if that assumption is not justified?
In fact, one of the major downsides of climate change is that warm air can hold more water vapor, leading to greater amounts of rainfall and more extreme weather. It’s extremely hard to say whether climate change is responsible for a single event like the Louisiana floods. But scientists agree that climate change will likely increase the frequency of major floods.
Flood maps from around the US
So are current flood maps useless? Far from it. Today’s flood maps are still the best tool we have to estimate where flooding will most likely occur. Using Temblor’s web app, we can look at flood risk anywhere FEMA has published a flood map. Here are some cities that could get hit by floods in the future:

Due to its proximity to the Gulf of Mexico, Houston is perpetually at risk of high rainfall and flash floods. In the past year, several major floods have hit the triangle between Houston, Dallas, and San Antonio, including one in June that caused the deaths of nine Fort Hood soldiers.
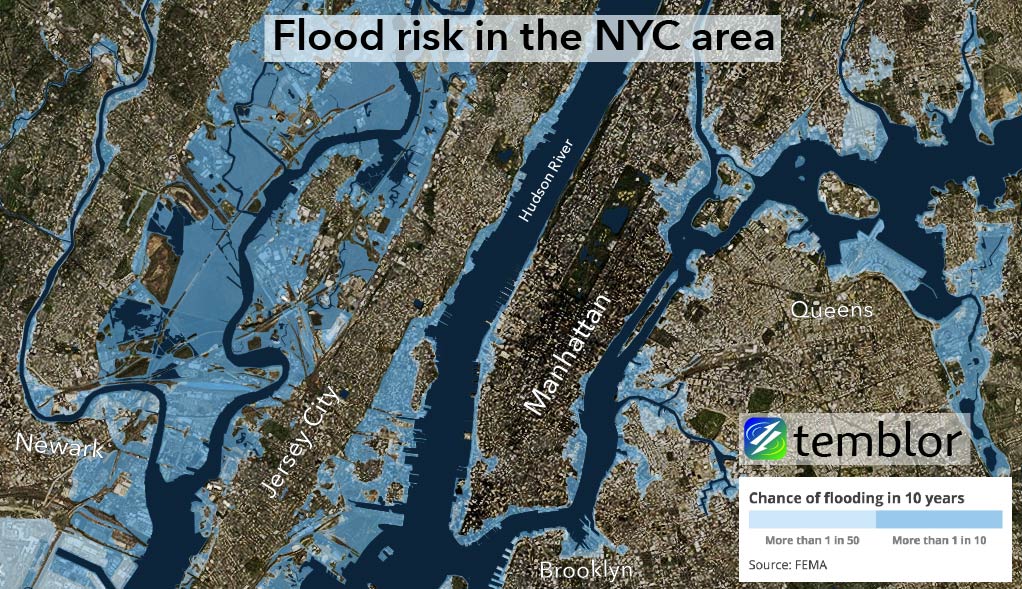
Residents of New York and New Jersey remember Superstorm Sandy, which flooded much of the NY metropolitan area, including parts of Brooklyn, Manhattan, Newark, and Jersey City. Actual flooding from the superstorm closely resembled FEMA’s flood maps of the region.
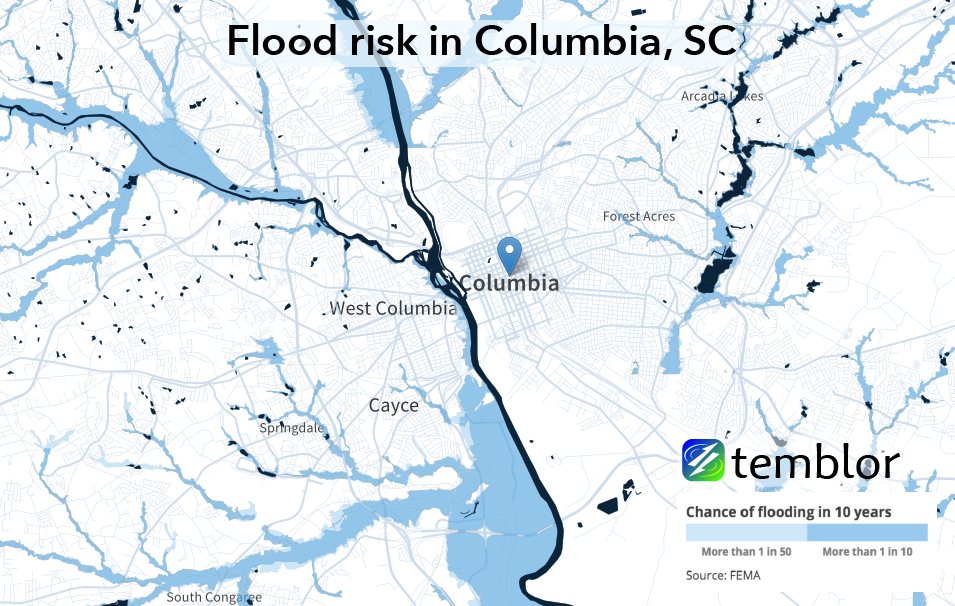
Heavy rainfall in Columbia, South Carolina, caused widespread flooding in October 2015. Floods also devastated Charleston, Berkeley, and Dorchester Counties.
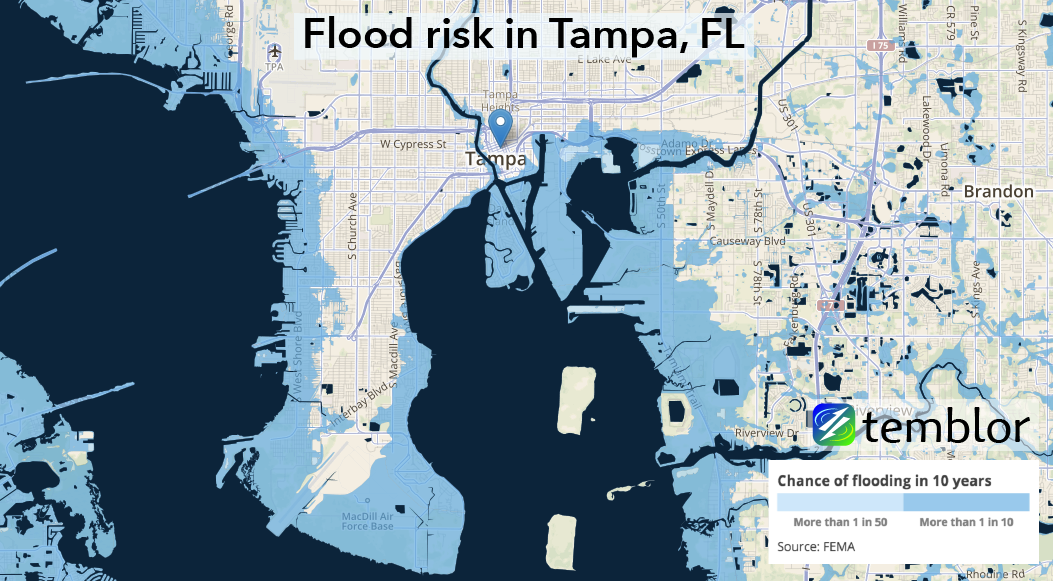
Experts in the Tampa Bay area warn that Tampa and St. Petersburg could be hit by huge floods like those in Baton Rouge. Looking at Tampa flood maps, it’s easy to see why.

Even in drought-addled California, flash floods can cause major damage. FEMA’s flood maps of the San Francisco Bay Area show that there is considerable flood risk throughout Silicon Valley, including San Jose, Santa Clara, Palo Alto, and Fremont. In California, the old saying is true: When it rains, it pours.
You can discover your flood risk anywhere in the US with Temblor’s flood maps. Go to app.temblor.net, find the layers icon in the top-right, and select the “Flood” layer.
Sources
FEMA flood maps
Bromwich, Jonah Engel. “Flooding in the South Looks a Lot Like Climate Change.” New York Times, 16 Aug 2016.
- Earthquake science illuminates landslide behavior - June 13, 2025
- Destruction and Transformation: Lessons learned from the 2015 Gorkha, Nepal, earthquake - April 25, 2025
- Knock, knock, knocking on your door – the Julian earthquake in southern California issues reminder to be prepared - April 24, 2025