By Alberto M López, Ph.D., K. Stephen Hughes, Ph.D. and Thomas R. Hudgins, Department of Geology, University of Puerto Rico – Mayaguez Campus
Elizabeth Vanacore, Ph.D. and Gisela Báez-Sánchez, B.S., Puerto Rico Seismic Network, Department of Geology, University of Puerto Rico – Mayaguez Campus
On Dec. 28, 2019, a magnitude-4.7 quake kicked off an ongoing seismic sequence in Puerto Rico, which includes the magnitude-6.4 mainshock on Jan. 7. Seismicity continues to rattle the island.
Citation: Alberto M López, Elizabeth Vanacore, K. Stephen Hughes, Gisela Báez-Sánchez, and Thomas R. Hudgins (2020), Response and initial scientific findings from the southwestern Puerto Rico 2020 Seismic Sequence, Temblor, http://doi.org/10.32858/temblor.068
Since Dec. 28, 2019, southwestern Puerto Rico has been experiencing an ongoing seismic sequence with the largest earthquake, magnitude-6.4, occurring on Jan. 7, 2020. The mainshock, along with its thousands of aftershocks, is a new experience for the population of southwestern Puerto Rico that is unaccustomed to significant ground motions—particularly those that result in substantial damages. The goal of this article is to share how earth scientists from the Department of Geology at the University of Puerto Rico – Mayagüez have been responding to and learning from the seismic sequence. This article serves as an update to the previous article featured on Temblor the same day of the earthquake [López et al., 2020]. We present preliminary field observations and describe instrumentation that has been deployed to better understand the enigmatic seismic activity of the region. Our goal is to bring valuable information to the population seeking to learn more about the events.
Earthquake locations to date
Since the onset of activity, scientists at the Puerto Rico Seismic Network have been continuously monitoring earthquakes associated with this sequence. With seismicity impacting the public in Puerto Rico, the first priority of the Puerto Rico Seismic Network is to process both felt and significant earthquakes (magnitude greater than or equal to 3.5) within the Puerto Rico and Virgin Islands region. The second priority is to process all seismic events detected by the automatic location system, regardless of magnitude or location within the Puerto Rico and Virgin Islands region, as per the Puerto Rico Seismic Network mission.
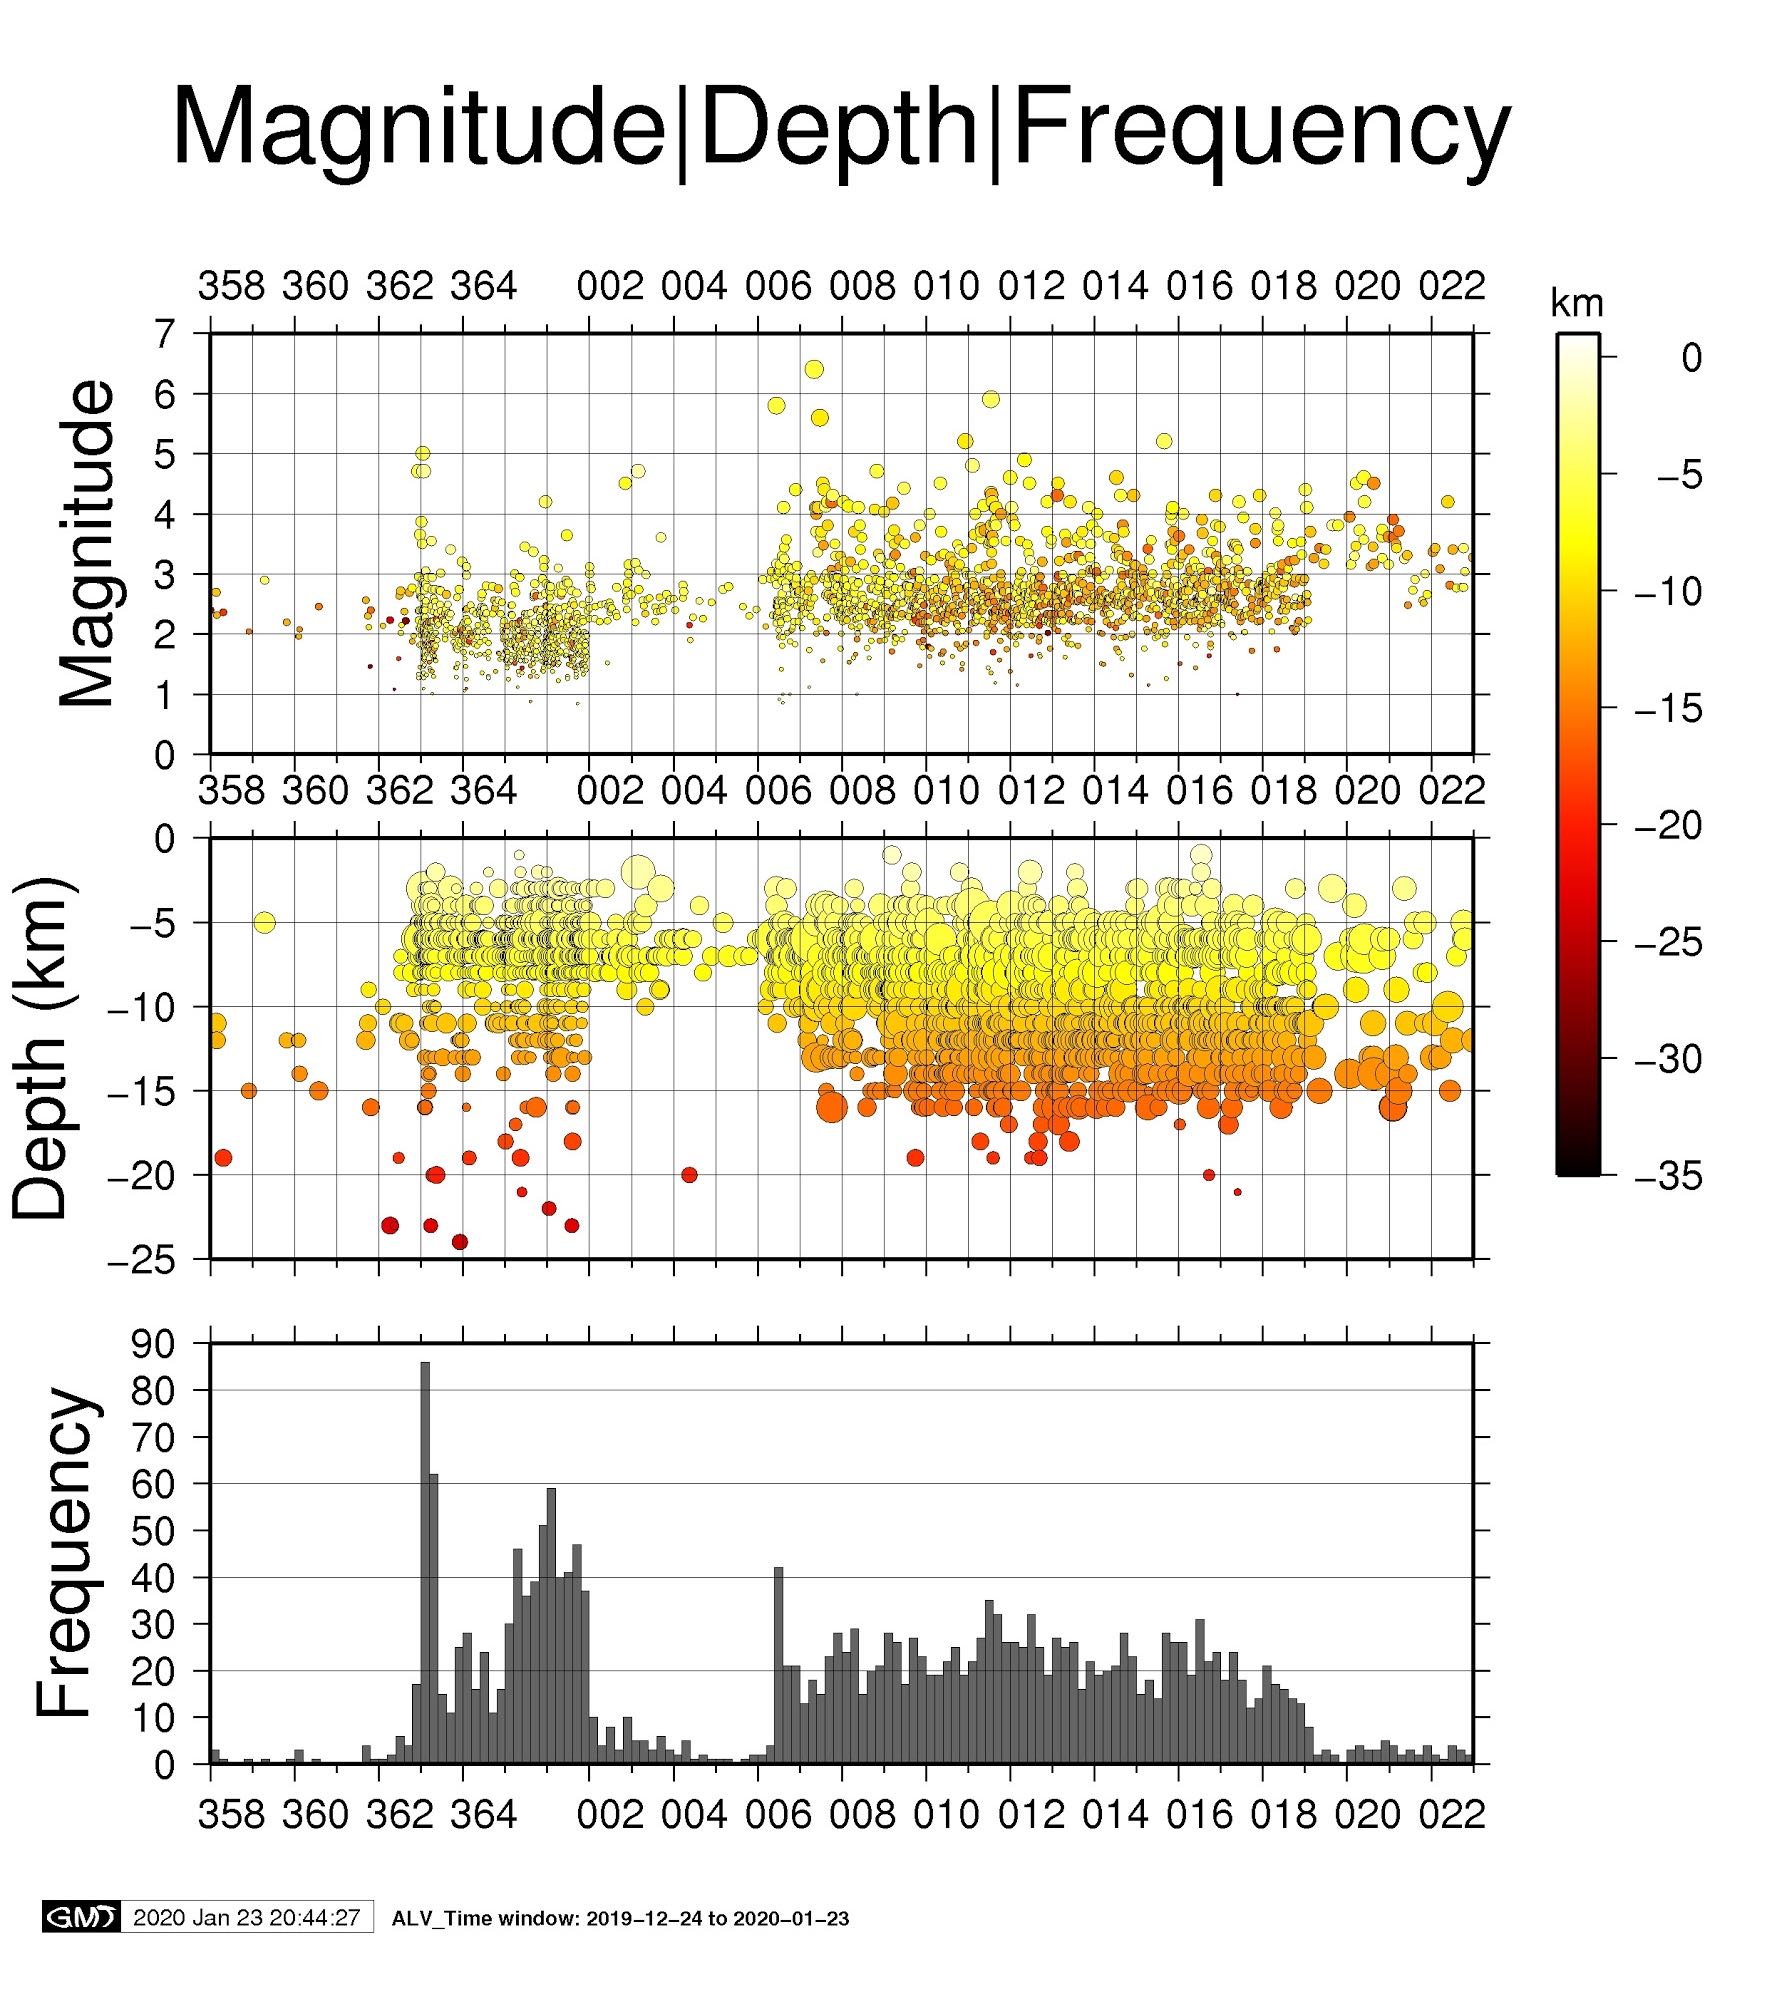
As of Jan. 24, 2020, greater than 2,550 events associated with this sequence have been processed by scientists at the Puerto Rico Seismic Network.
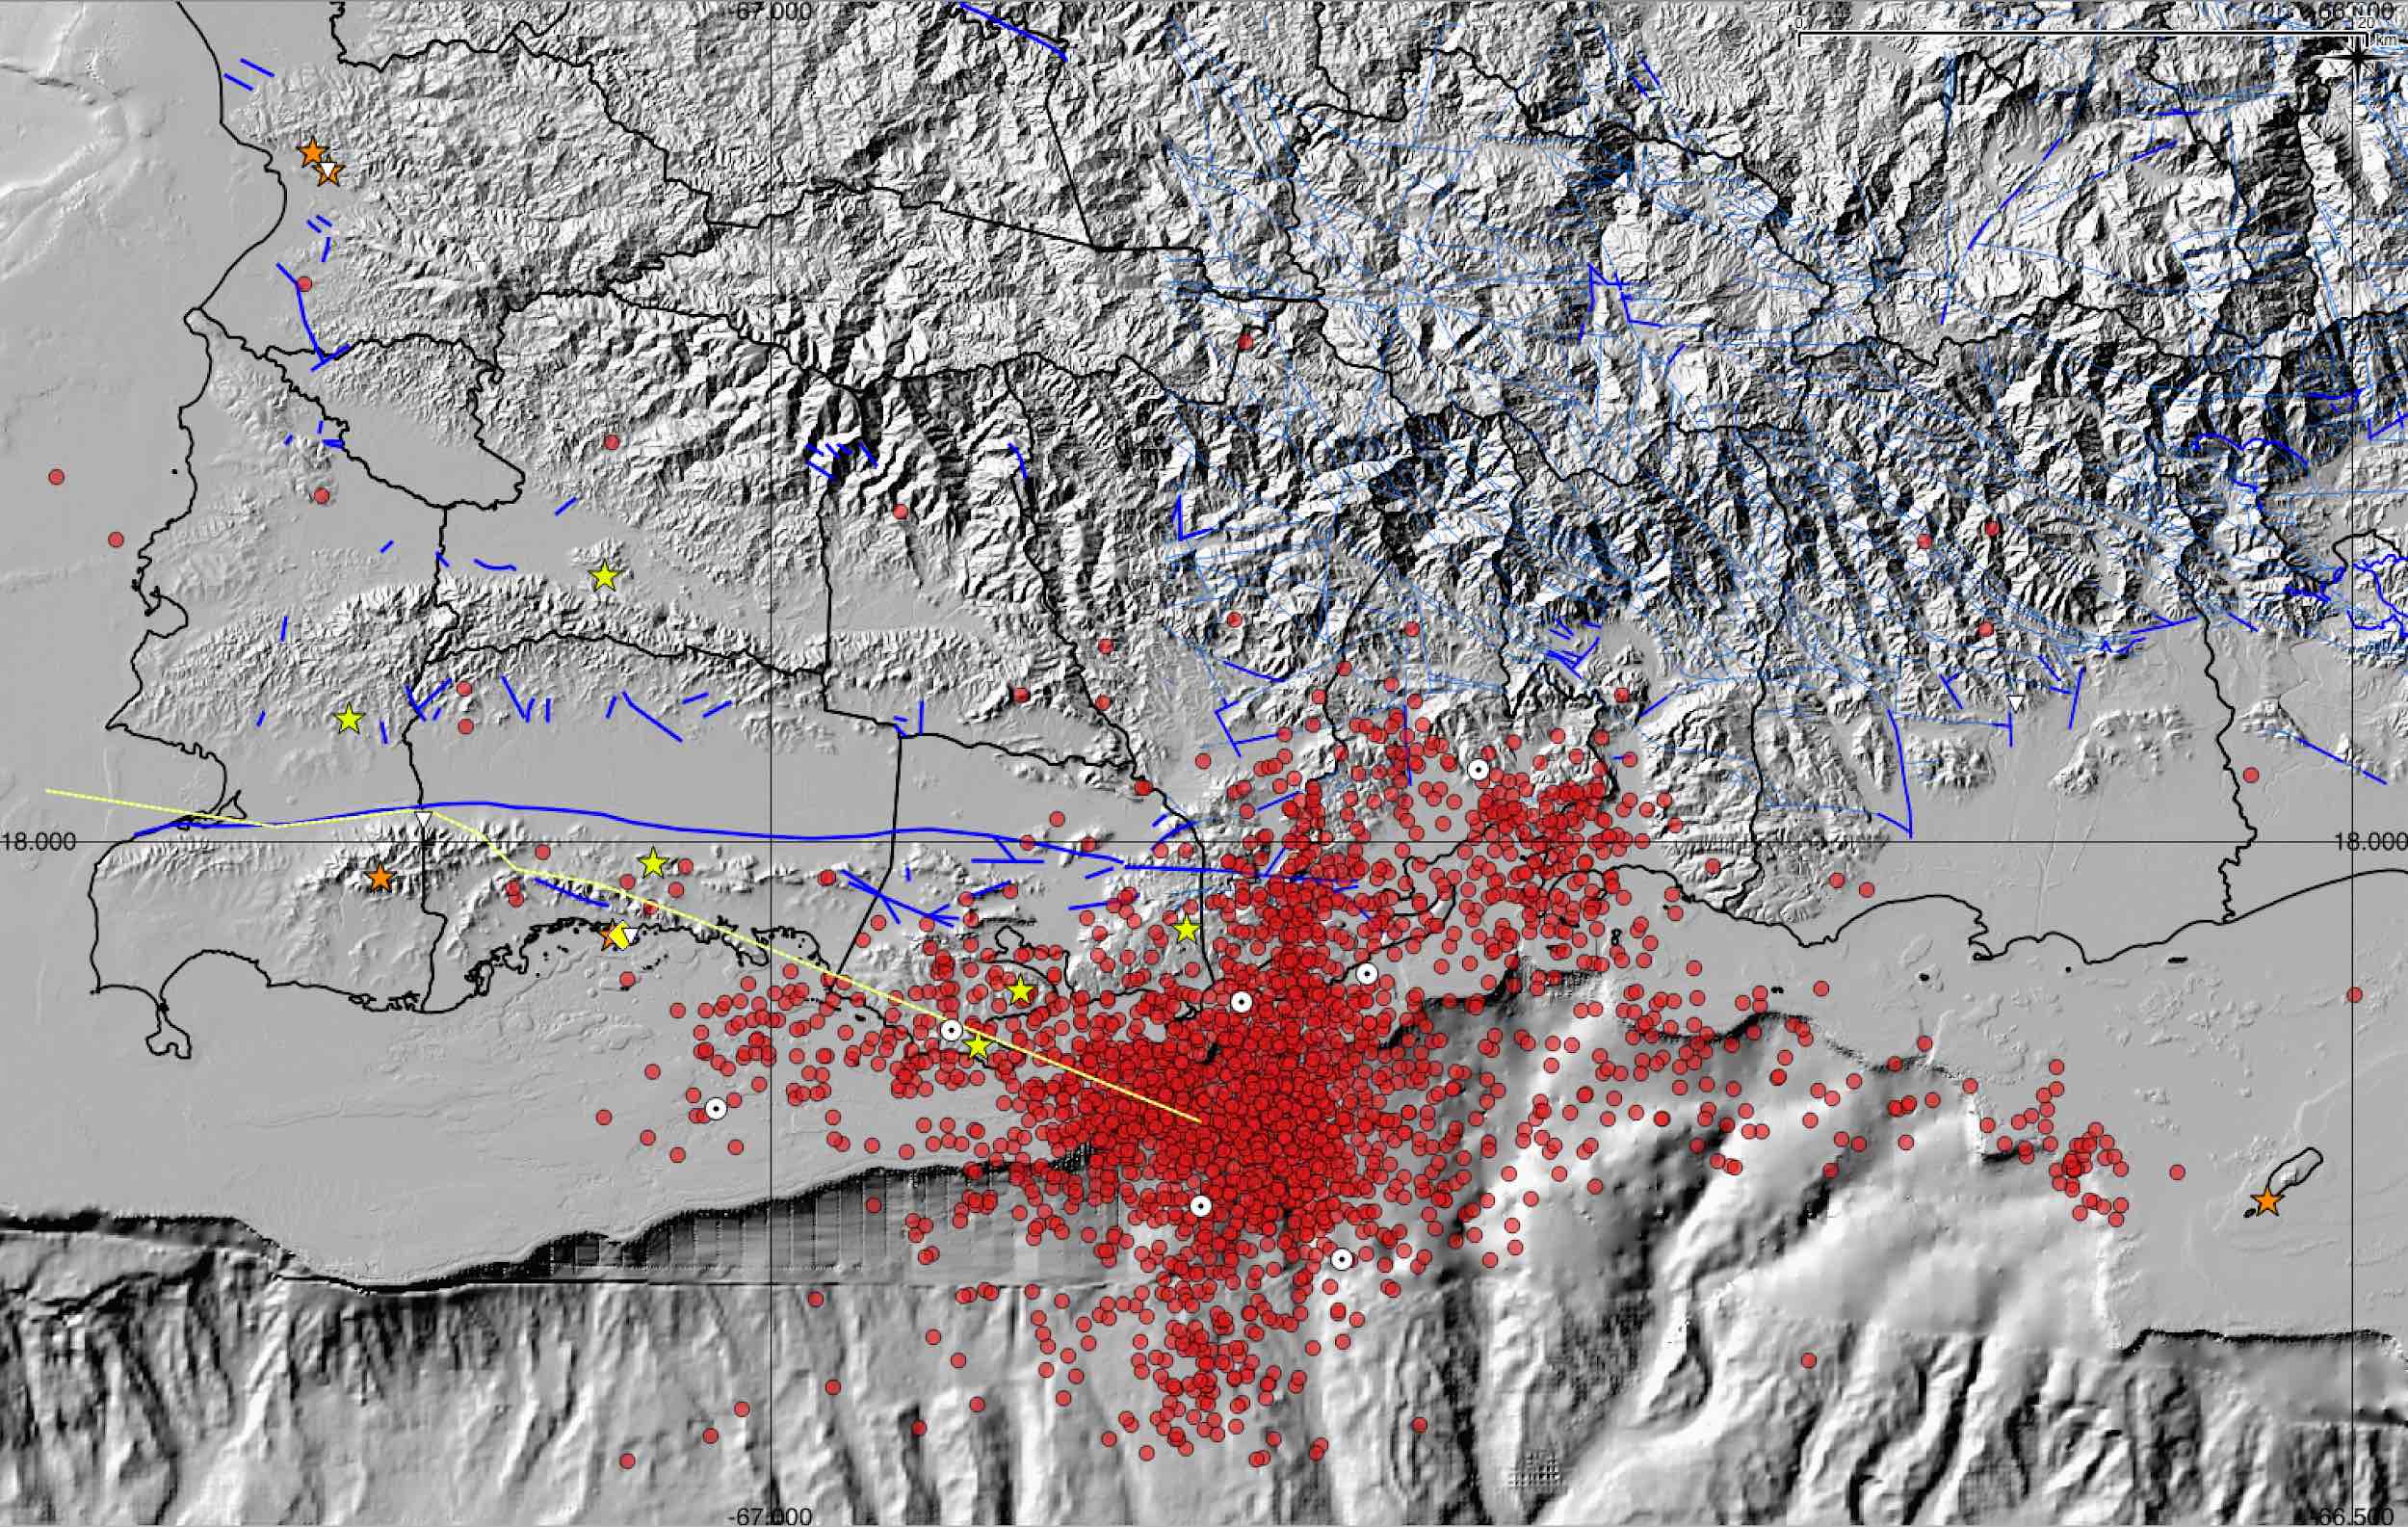
Of those 2,550 events, geophysical data analysts have processed 1,953 events too small to be felt between Dec. 28, 2019 and Jan. 24, 2020, and 275 felt events in the entire Puerto Rico and Virgin Islands region.
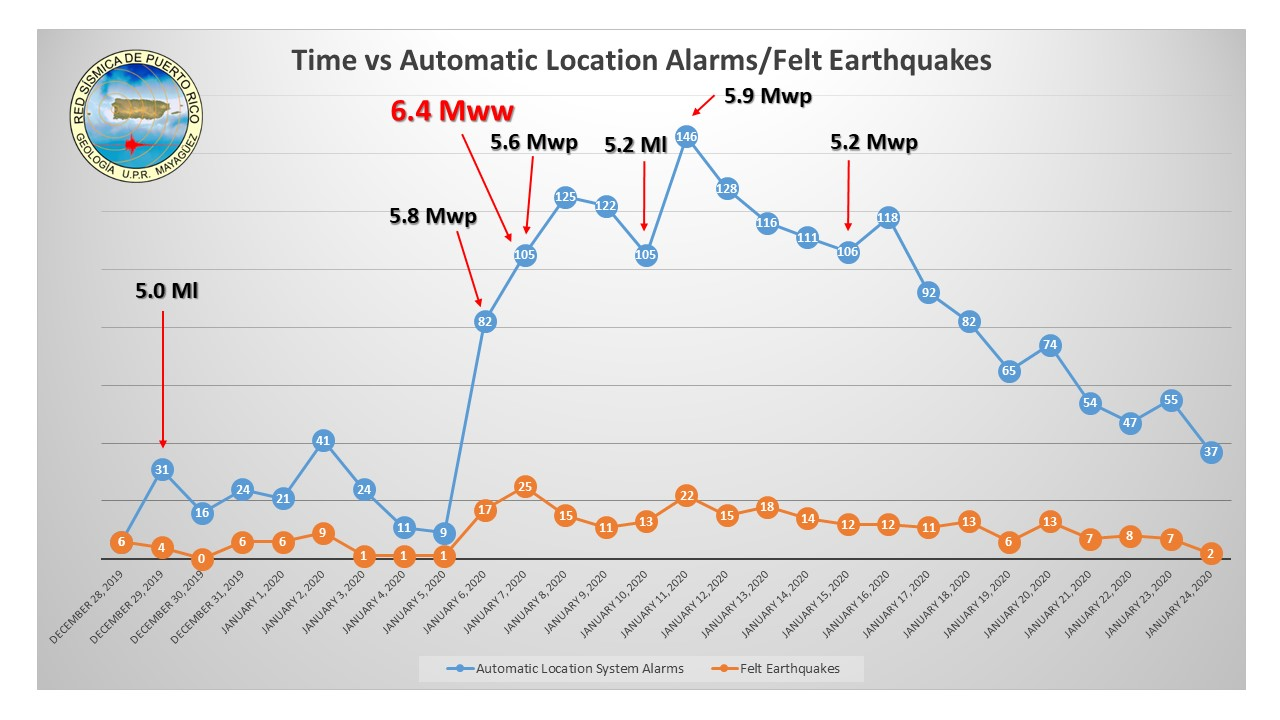
Of the felt events, 272 were located in the Southwestern Puerto Rico Seismic Sequence. It is critical to note that every event is manually reviewed by a Puerto Rico Seismic Network geophysical data analyst prior to submission to the Puerto Rico Seismic Network and U.S. Geological Survey (USGS) catalogs. Therefore, as a consequence of the high volume of seismicity and the prioritization of event processing, there is a delay in processing small magnitude, unfelt earthquakes, and a consequent delay in updating the Puerto Rico Seismic Network and USGS catalogs. These low-priority small-magnitude events are currently being processed by analysts at the Puerto Rico Seismic Network, and the earthquake catalogs will continue to be updated in the coming days and weeks. The delay in processing has resulted in noticeable gaps in the earthquake catalog. For example, starting on Jan. 2, 2020, all microseismicity locations were put on hold when the largest-magnitude events in the sequence, those of Jan. 6, 7, and 11, occurred and were given priority. As time permits, geophysical analysts will revisit the data and locate all smaller events to provide a better understanding of the region’s seismicity.
Temporary Instrument Deployment
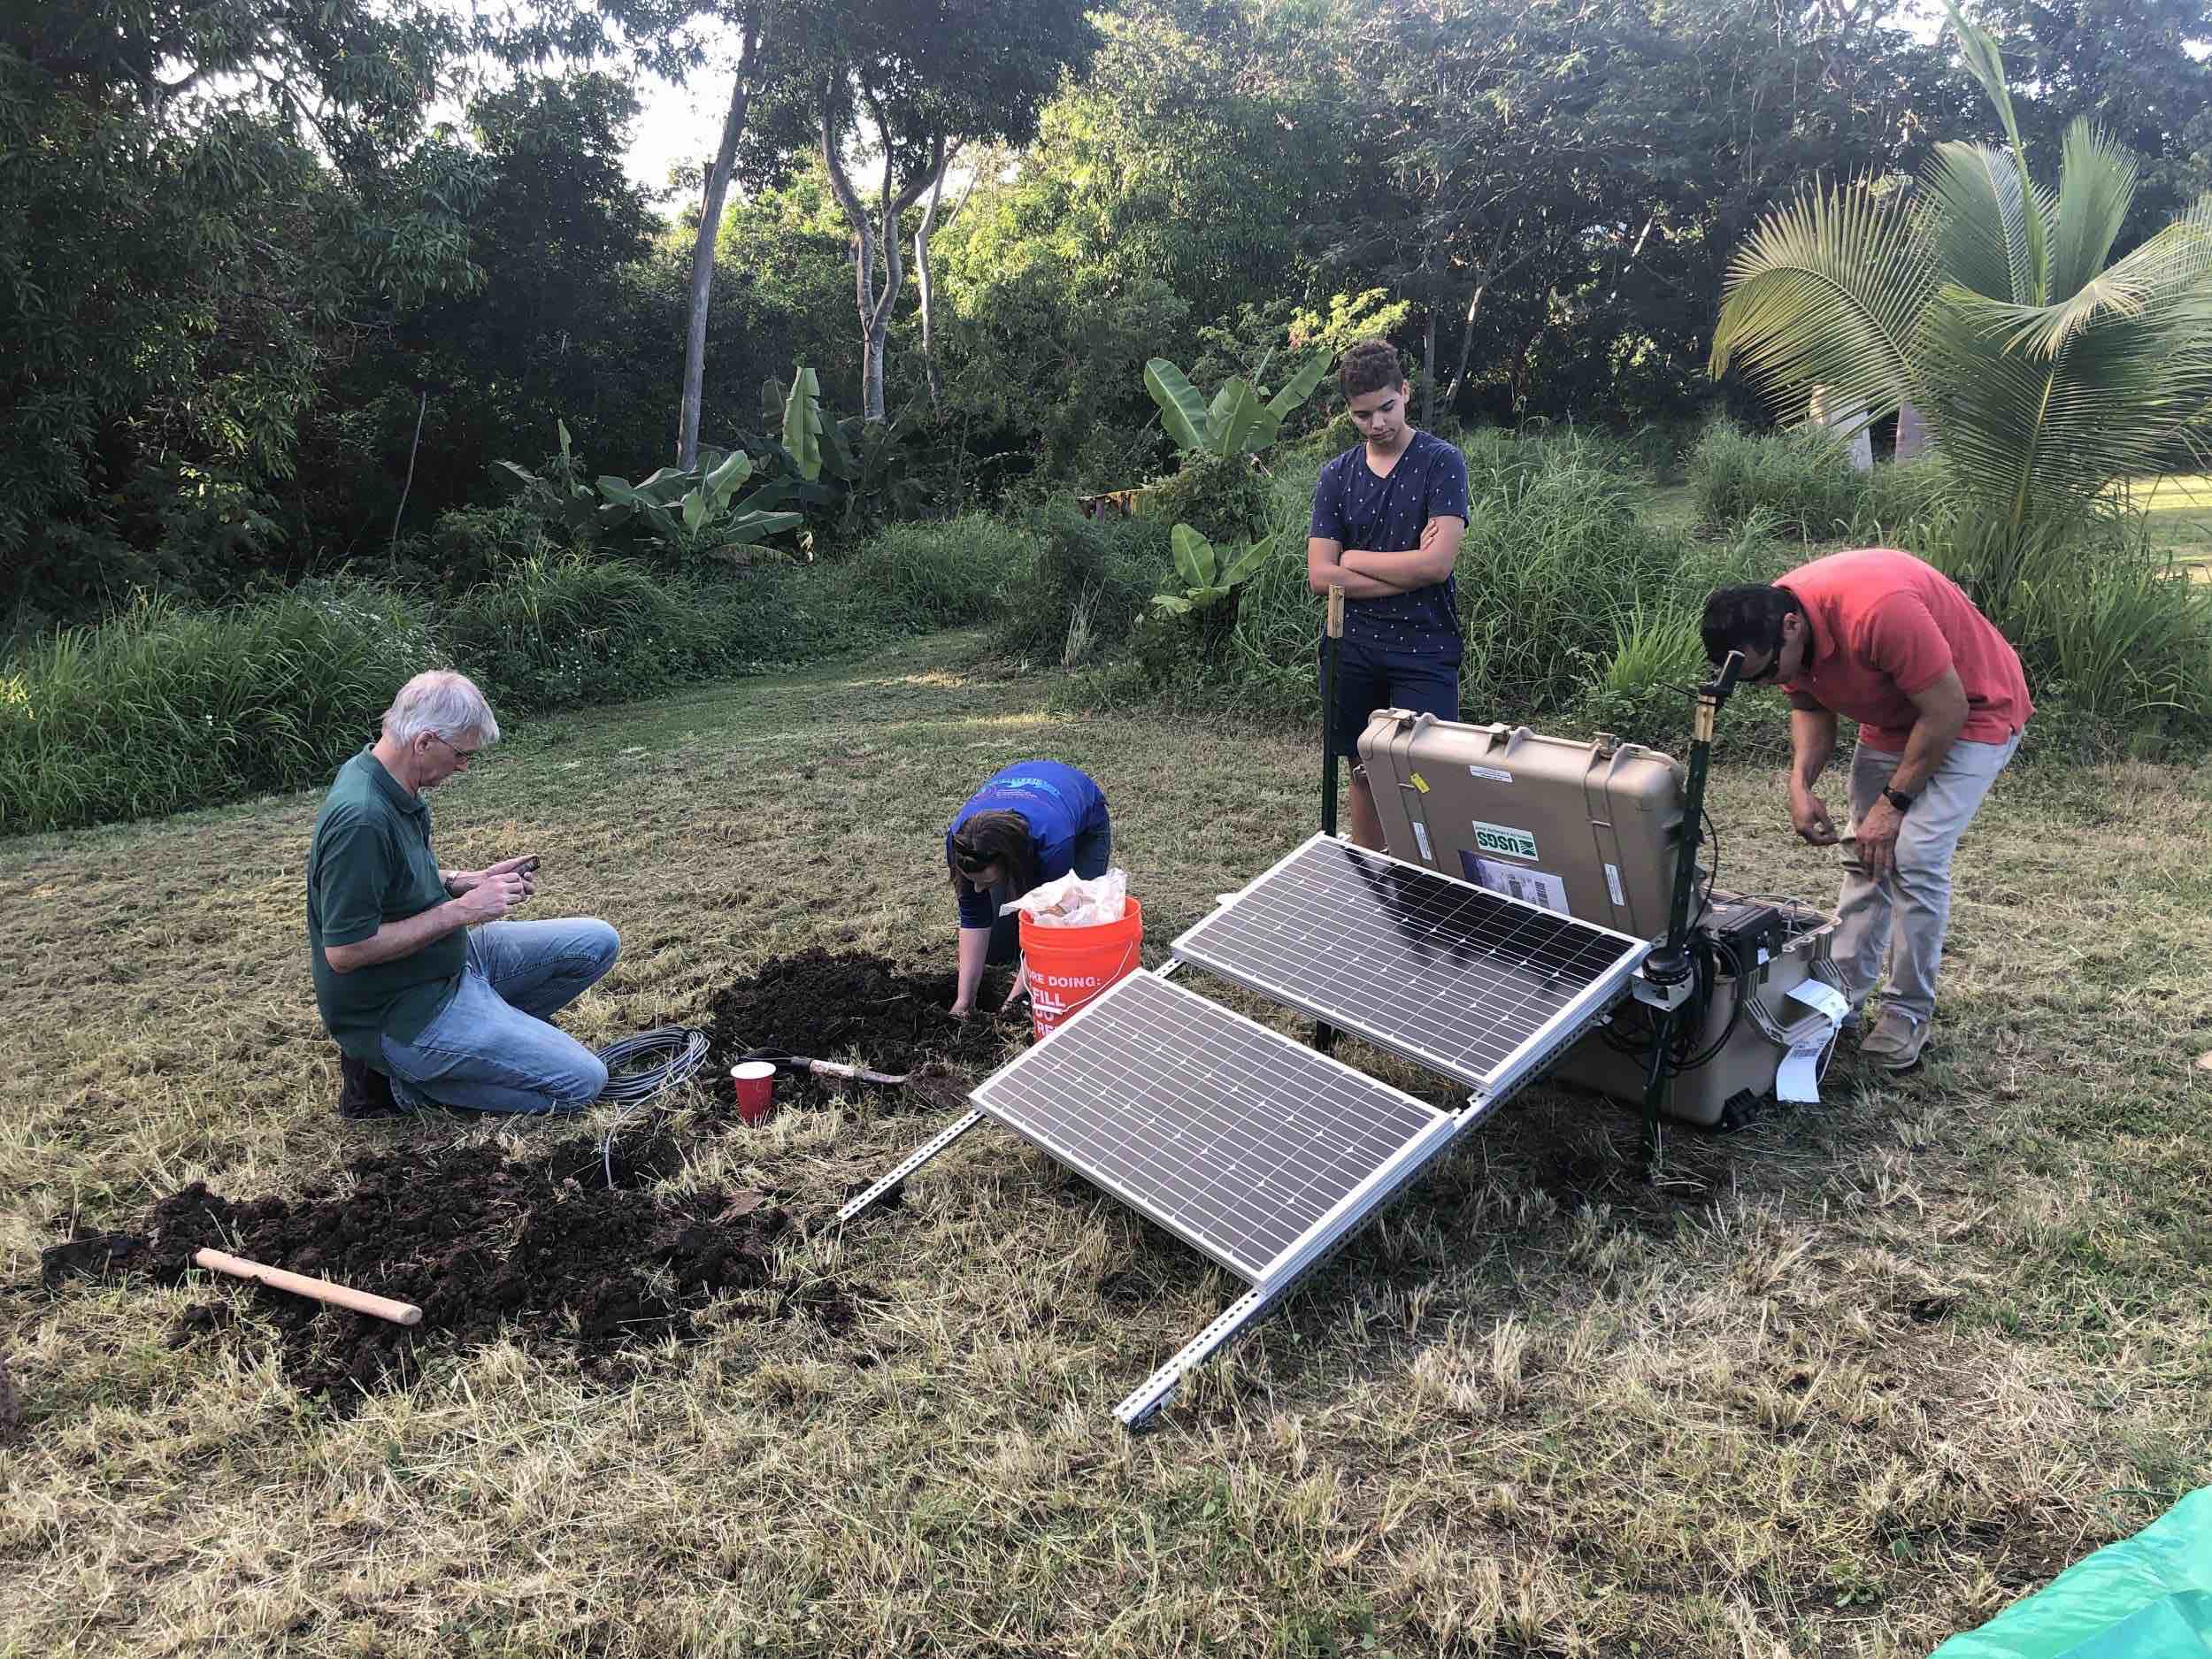
To better monitor the ongoing seismic sequence, scientists at the Puerto Rico Seismic Network, in collaboration with the USGS, deployed seismic instrumentation to nine new sites and improved/re-occupied two current Puerto Rico Seismic Network station sites.

At each of these sites both a broadband seismometer and accelerometer were installed. Of these sites, six currently provide real-time data to the regional and federal agencies. The additional stations not only measure seismicity to help scientists monitor the sequence, but they also provide data that can be used to study general ground motion equations in Puerto Rico, which in turn are expected to improve future seismic hazard maps.
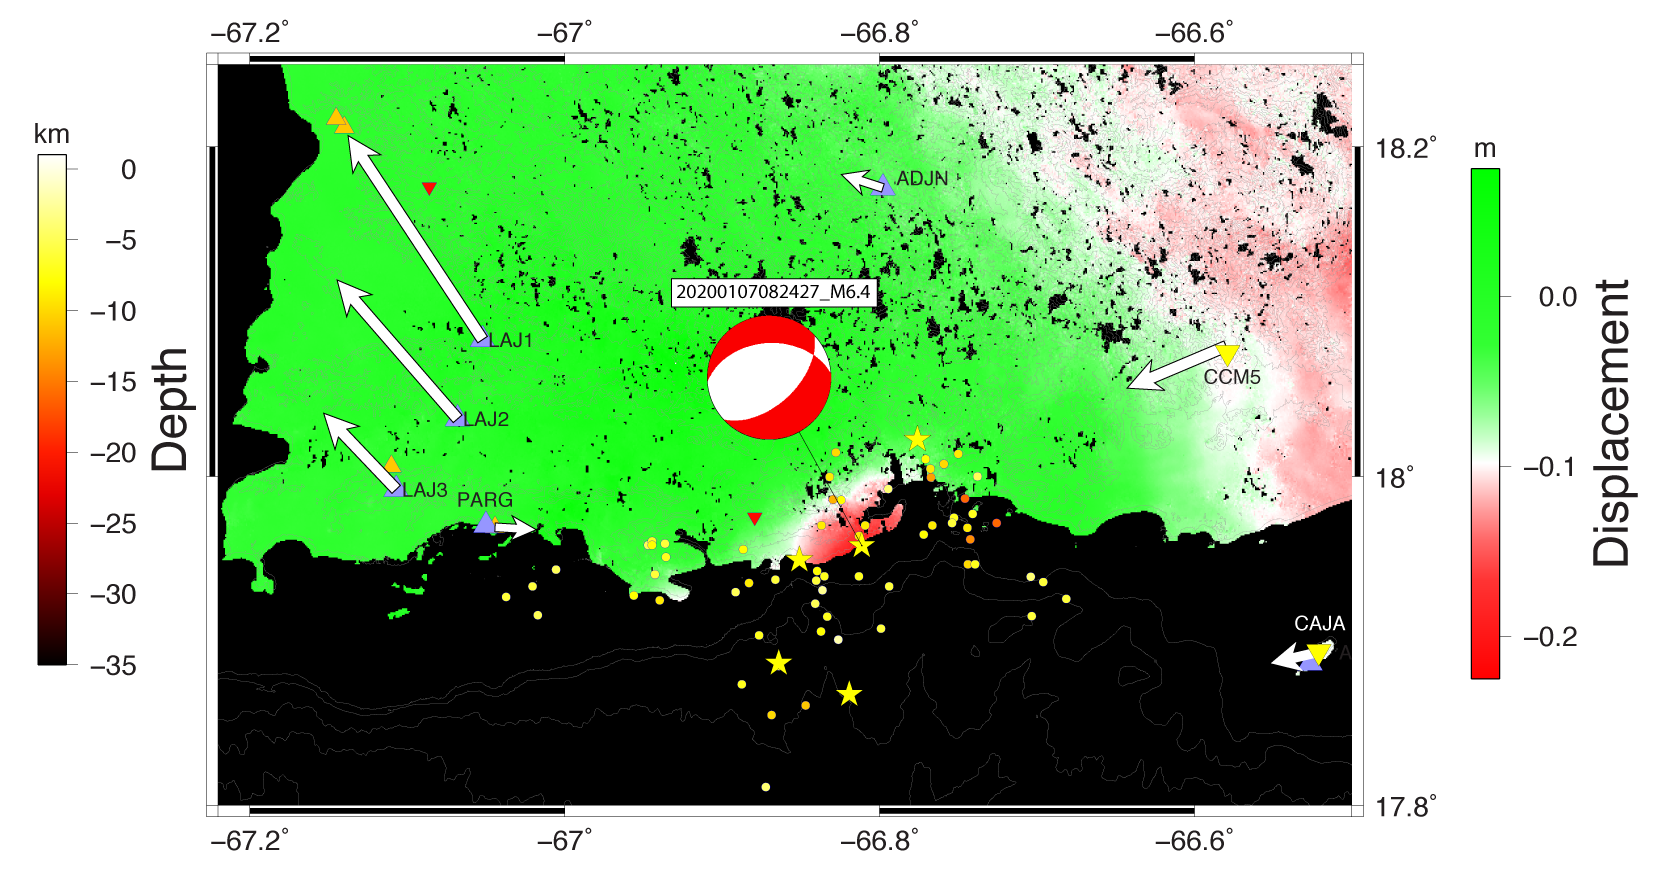
Initial earthquake locations from the Puerto Rico Seismic Network in combination with initial focal mechanisms from the Advanced National Seismic System Comprehensive Earthquake Catalog [USGS, 2017] indicate that the current sequence is occurring across multiple faults. Preliminary evaluation of the focal mechanisms and event distribution in space and time indicate that early motion along the left-lateral Punta Montalva strike-slip fault induced the primary Jan. 7, 2020, magnitude-6.4 earthquake along a nearby normal fault via stress transfer. This complex system involving multiple faults is reminiscent of the 2016 Kaikoura New Zealand event that involved rupture on over 20 faults [Litchfield et al., 2018], although rupture in Puerto Rico is spanning days rather than minutes. Data from the current seismic deployment will help unravel the dynamics of this active faulting.
Similarly, in an effort to estimate co-seismic and post-seismic displacements due to the Jan. 7, 2020, magnitude-6.4 earthquake, 16 temporary, or campaign-style GPS sites are being re-occupied.

For a typical campaign-style GPS site, data collection lasts for a week, and then the equipment is moved to the next site. Using the focal mechanism computed by the USGS, D. Mencin from UNAVCO provided predicted static offsets at the location of episodic GPS sites within Puerto Rico [Mencin et al., 2020]. Comparing the post-seismic velocity field from the re-occupation of campaign sites will allow validation of focal mechanisms obtained from seismic sources. In addition, permanent GPS sites in Puerto Rico yield the co-seismic offset due to the earthquake, which is in agreement with interferometry estimates obtained from the analysis of the Sentinel-1 satellite computed by E. Fielding at NASA. Both datasets support a northeast-trending normal fault where the southeast side moves down relative to the northwest side of the fault.
Ground Failure Observations
Personnel deployed from the USGS Geologic Hazards Science Center and the National Science Foundation Geotechnical Extreme Events Reconnaissance Association have worked with local geologists and geotechnical engineers at the University of Puerto Rico – Mayagüez Campus to survey the ground failure response to shaking. Most observations have been in the local epicentral coastal area and consist of lateral spreading, liquefaction, rock falls, and slumps.
Examples of lateral spreading are mostly observed parallel to the coastline or river channels.

These are common in sites visited along the coastal zone between Guánica and Ponce, which is an approximately 35-kilometer stretch of shoreline.

Evidence of liquefaction is sparse but present. Liquefaction thus far appears to have very little effect on structures. Such sites are exclusively along the coast and in low-lying areas


The epicentral area is underlain primarily by limestone bedrock units, mostly the Miocene-Pliocene (between approximately 10 and 4 million years old) Ponce Limestone Formation. In addition, the climate of the south coast is the most arid of all microclimate zones across the island. Due to the rock type and relative dearth of chemical weathering, the primary mass wasting mechanisms due to ground shaking have been rock falls and small slumps.

Among others, many near-vertical road cuts along PR-333 in Guánica, PR-335 in Guayanilla, and PR-385 in Peñuelas were sites of abundant small rock falls. In addition, a much larger rock fall has periodically failed during aftershocks along highway PR-2 within a few meters of the Caribbean Sea at the border of the municipalities of Peñuelas and Ponce. The roadway has been shifted away from the rockfall scar as much as possible for the time-being. Failures of natural, non-modified slopes are less common, but have nevertheless occurred, and in many places boulders from limestone cliffs have been scattered on the terrain below. These are in addition to the collapse of the Punta Ventana sea arch in Guayanilla [López et al., 2020].

Hydrological Response
After large earthquakes, changes in hydrological systems are commonly observed. In southwestern Puerto Rico, after the magnitude-6.4 event, there have been notable changes in the base flow of certain rivers closest to the epicentral region, as well as changes in the temperature and volumetric flow rate at hot springs located about 45 kilometers east of the active seismic area. Both the Rio Guayanilla and Rio Yauco show an increase in baseflow conditions that coincide with the largest event in the sequence on Jan. 7, 2020.
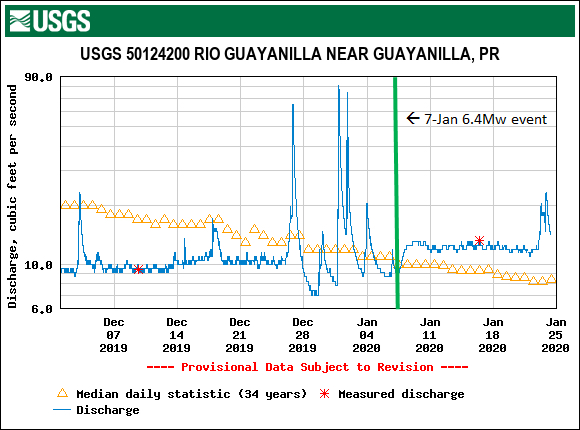
The Rio Guayanilla pre-event base flow at the gauging site was consistently approximately 10 cubic feet per second during December 2019. After the largest event, the flow rate rose by about 30% to consistently approximately 13 feet per cubic second. Similarly, at the Rio Yauco site, the stream gauge during base flow conditions was less than 2.5 feet during December 2019. After the largest event, it is consistently above 2.5 feet at base flow.

The Coamo hot springs site, well-removed from any structural or other geological effects of the shaking, experienced water temperature fluctuations much greater than usual. Water temperatures at the principal spring are normally around 42-43°C [Guzmán-Ríos, 1988], but have risen as high as 48.5°C in the days since the magnitude-6.4 earthquake (pers. comm., Mayor Juan Carlos García Padilla, Jan. 14, 2020). The shaking has also coincided with significantly increased discharge at the hot springs, resulting in new seeps across the complex, higher pressures of the water jets, and water overflowing the wells.


Local universities, the Puerto Rico Department of Natural Resources, and the USGS have been collaborating with the municipality of Coamo to monitor and study the chemistry, temperature, and discharge of the thermal springs during the remainder of the seismic sequence.

Tsunami Observations
According to the moment tensor computed by the USGS, the magnitude-6.4 event on Jan. 7, 2020 occurred at a depth of 10 kilometers on a north-northeast striking normal fault with an epicenter just a few hundred meters off the southern coast of Puerto Rico. As a result, a minor tsunami was generated and observed at sea level stations throughout the region. Whether the fault dips to the northeast or northwest is still uncertain, but analysis of first wave arrival polarity and aftershock distribution could provide clues.

Four NOAA tidal gauge stations and one from Puerto Rico Seismic Network recorded wave fluctuations associated with the small tsunami. The NOAA tidal gauge station in Magueyes Island (magi) was the closest to the epicenter and recorded the maximum peak-to-peak value of 4.9 centimeters. First wave arrival was 18 minutes after origin time (08:24:27 UTC). NOAA station Lameshur Bay (lame) at St. John, one of the U.S. Virgin Islands, is the most distant tidal gauge station, with the first wave observed at 09:01:00 UTC. Interestingly, the first wave arrival at NOAA station in Punta Cana, Dominican Republic (pcan) arrived four minutes after the Lameshur Bay station, even though pcan is closer to the epicentral region. The maximum peak-to-peak amplitude (6.3 centimeters) was observed at the NOAA tidal gauge station in Vieques (Esperanza, vieq). Unfortunately, not all sea level monitoring stations were operational at the time of the event. Whether the observed tsunami was triggered by static seafloor dislocation or a submarine landslide will require marine geophysical observations to discriminate between the two possible sources. The USGS Woods Hole Science Center is organizing a survey for the end of February, 2020, to provide preliminary results of seafloor deformation. Data from multibeam bathymetry surveys will be of great assistance to understand the generation of the subtle tsunami.
Special SSA session (Jan. 29, 2020 deadline)
We would also like to highlight the Seismological Society of America 2020 conference special session dedicated to this earthquake sequence. Papers are invited from all aspects related to the magnitude-6.4 Jan. 7, 2020 earthquake and associated aftershocks and precursory activity. Data from seismic stations, sea level stations, interferometry, GPS, and many other sources are freely available for analysis. Deadline to submit abstracts to this special session of SSA 2020 is on Wed., Jan. 29.
Acknowledgements
Our ability to provide information in this article is possible by the help and contribution of many collaborators that have demonstrated interest in the geology and seismicity of Puerto Rico. Without them, obtaining so much knowledge of what is happening in the fault area would have not been possible. We are in great debt to students from the Geology Department from the University of Puerto Rico – Mayaguez Campus, and geophysical data analysts from the Puerto Rico Seismic Network. We appreciate the effort and genuine collaboration from the USGS, with special thanks to Alena Leeds and Tom Pratt, who traveled to the island to help with the installation of temporary seismic stations, and Emily Wolin, who provided remote support to the field team. Thanks also to Kate Allstadt and Eric Thompson from the USGS, as well as Alesandra Morales Vélez and Miguel Pando from the UPRM Dept. of Civil Engineering who are the leaders of the NSF Geoengineering Extreme Events Reconnaissance (GEER) team in Puerto Rico. Thanks go to professors of the UPRM Geology Department and MS students Desiree Bayouth García, Edwin Irizarry Brugman, and Preiser Brunat for their assistance in the field. We appreciate also help from UNAVCO staff Glen Mattioli, Dave Mencin, Kathleen Hodginkson, and Beth Bartel for the GNSS data and analysis of crustal deformation. Also, we appreciate very much the Sentinel-1 data analysis provided by Eric Fielding from JPL-NASA at Caltech. Thanks also go to Stuart Weinstein from NOAA for providing the data on sea level stations.
References
Guzman-Rios, S. (1988). Hydrology and water quality of the principal springs in Puerto Rico. Water-Resources Investigations Report from the U.S. Geological Survey. USGS Publications Warehouse. In: http://pubs.er.usgs.gov/publication/wri854269.
Litchfield, Nicola J., Pilar Villamor, Russ J. Van Dissen, Andrew Nicol, Philip M. Barnes, David J. A. Barrell, Jarg R. Pettinga, Robert M. Langridge, Timothy A. Little, Joshu J. Mountjoy, William F. Ries, Julie Rowland, Clark Fenton, Mark W. Stirling, Jesse Kearse, Kelvin R. Berryman, Ursula A. Cochran, Kate J. Clark, Mark Hemphill‐Haley, Narges Khajavi, Katie E. Jones, Garth Archibald, Phaedra Upton, Cameron Asher, Adrian Benson, Simon C. Cox, Caleb Gasston, Dan Hale, Brendan Hall, Alexandra E. Hatem, David W. Heron, Jamie Howarth, Tim J. Kane, Geoffroy Lamarche, Steve Lawson, Biljana Lukovic, Samuel T. McColl, Christopher Madugo, John Manousakis, Duncan Noble, Kate Pedley, Katrina Sauer, Timothy Stahl, Delia T. Strong, Dougal B. Townsend, Virginia Toy, Jack Williams, Suzanne Woelz, Robert Zinke (2018), Surface Rupture of Multiple Crustal Faults in the 2016 Mw 7.8 Kaikōura, New Zealand, Earthquake Bulletin of the Seismological Society of America, 108, 1496–1520. doi: https://doi.org/10.1785/0120170300
López, A.M., Hughes, K.S., & Vanacore, E. (2020), Puerto Rico’s Winter 2019-2020 Seismic Sequence Leaves the Island On Edge, Temblor, http://doi.org/10.32858/temblor.064.
Mencin, D., Hodgkinson, K., and Bartel, B. (2020), Data Event Response to the January 7, 2020 M 6.4 Earthquake 8 km S of Indios, Puerto Rico, https://www.unavco.org/highlights/2020/puertorico.html, accessed January 11, 2020.
U.S. Geological Survey, Earthquake Hazards Program (2017), Advanced National Seismic System (ANSS) Comprehensive Catalog of Earthquake Events and Products: Various, https://doi.org/10.5066/F7MS3QZH.
- When Tokyo’s next big earthquake hits, could global markets crash? - March 20, 2026
- The Earthquake that Shook the South - February 26, 2026
- Introducing Coulomb 4.0: Enhanced stress interaction and deformation software for research and teaching - February 20, 2026