An earthquake that struck a remote part of the Yukon near the Alaska border on December 6, 2025 serves as an example of successful seismic hazard assessment.
By Ross Stein and Volkan Sevilgen, Temblor, Inc.
Citation: Stein, R.S. and Sevilgen, V., 2025, Magnitude 7 Yukon-Alaska earthquake strikes on the recently discovered Connector Fault, Temblor, http://doi.org/10.32858/temblor.370
Editor’s note: This article was updated on Dec. 11, 12, and 17, 2025, to clarify the discovery of the Connector Fault. On Dec. 11, the authors also added locations to Figure 2 to help readers orient themselves. On Dec. 12, 2025, reviewers were listed, changes were made to the section about the birth of the Connector Fault, and the citations updated. On Dec. 17, we clarified that the quake occurred in Yukon, Canada.
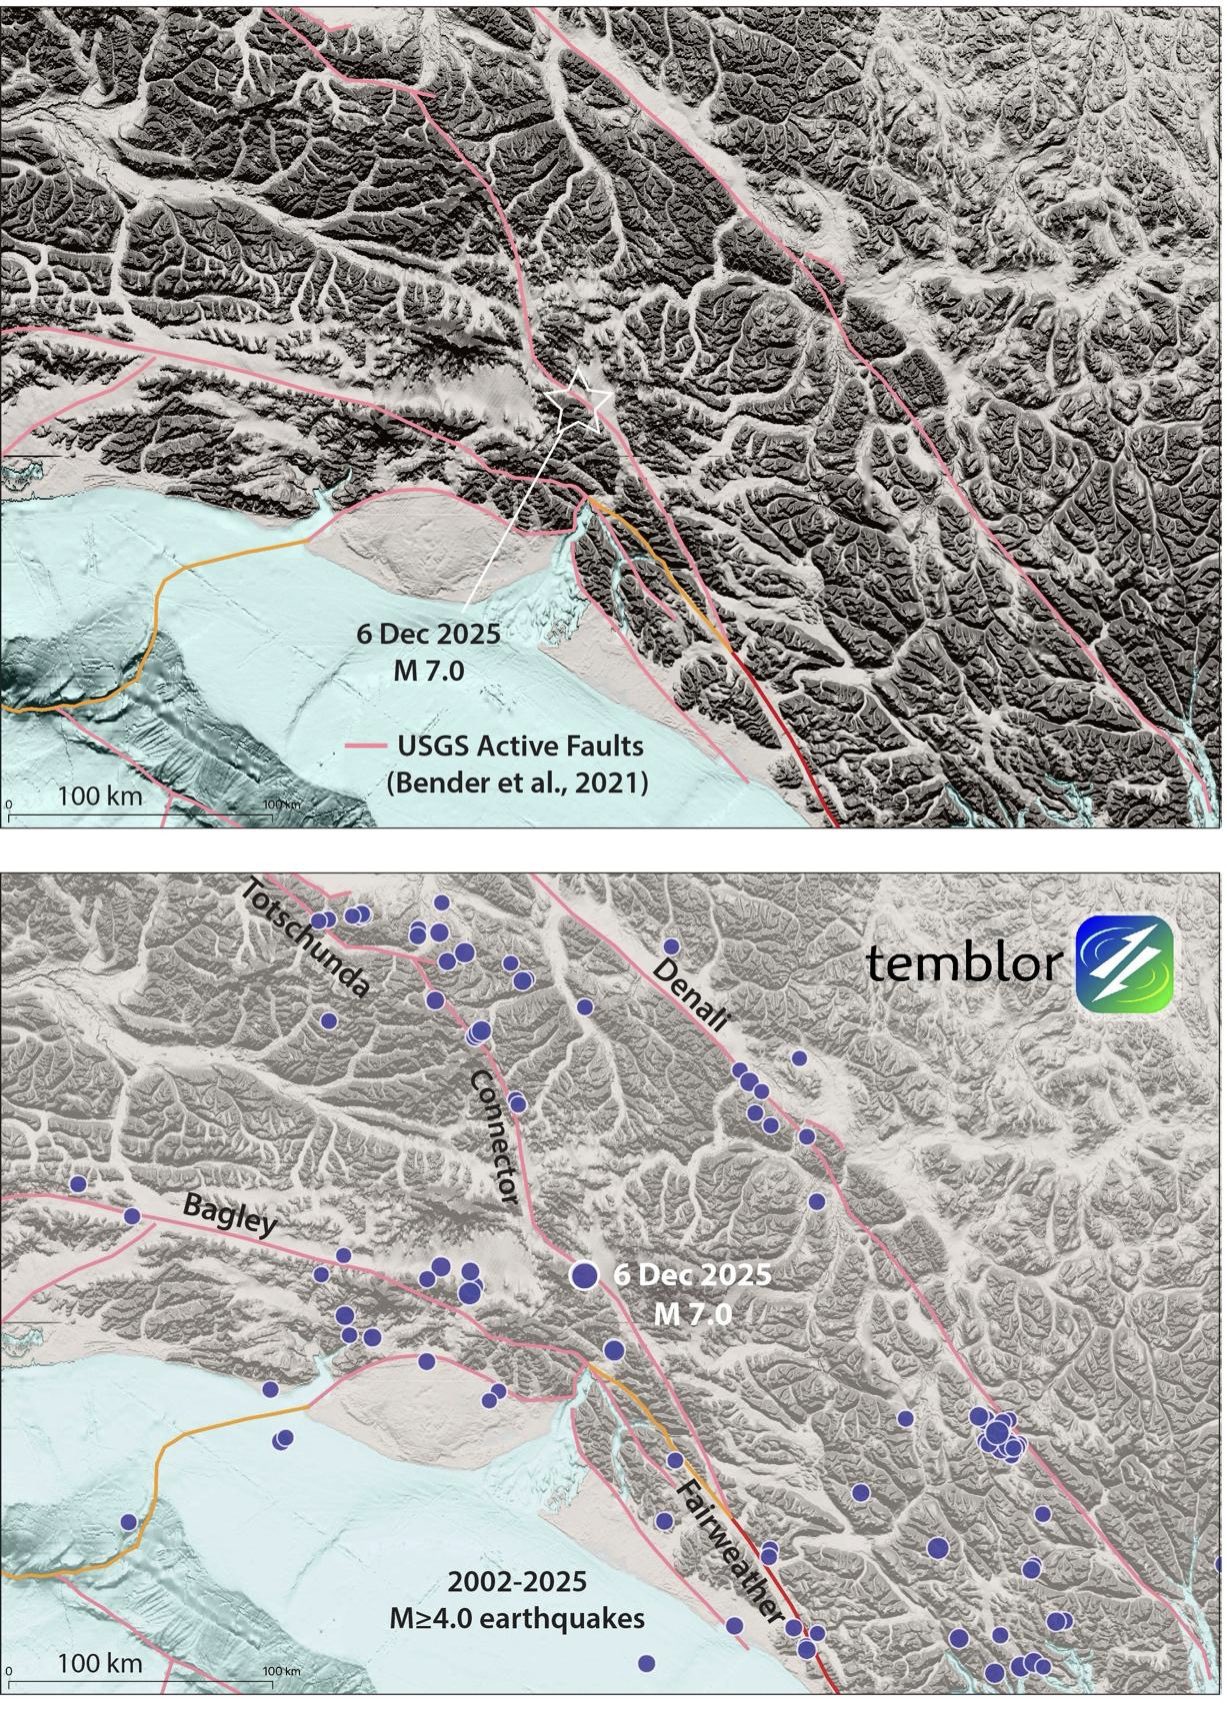
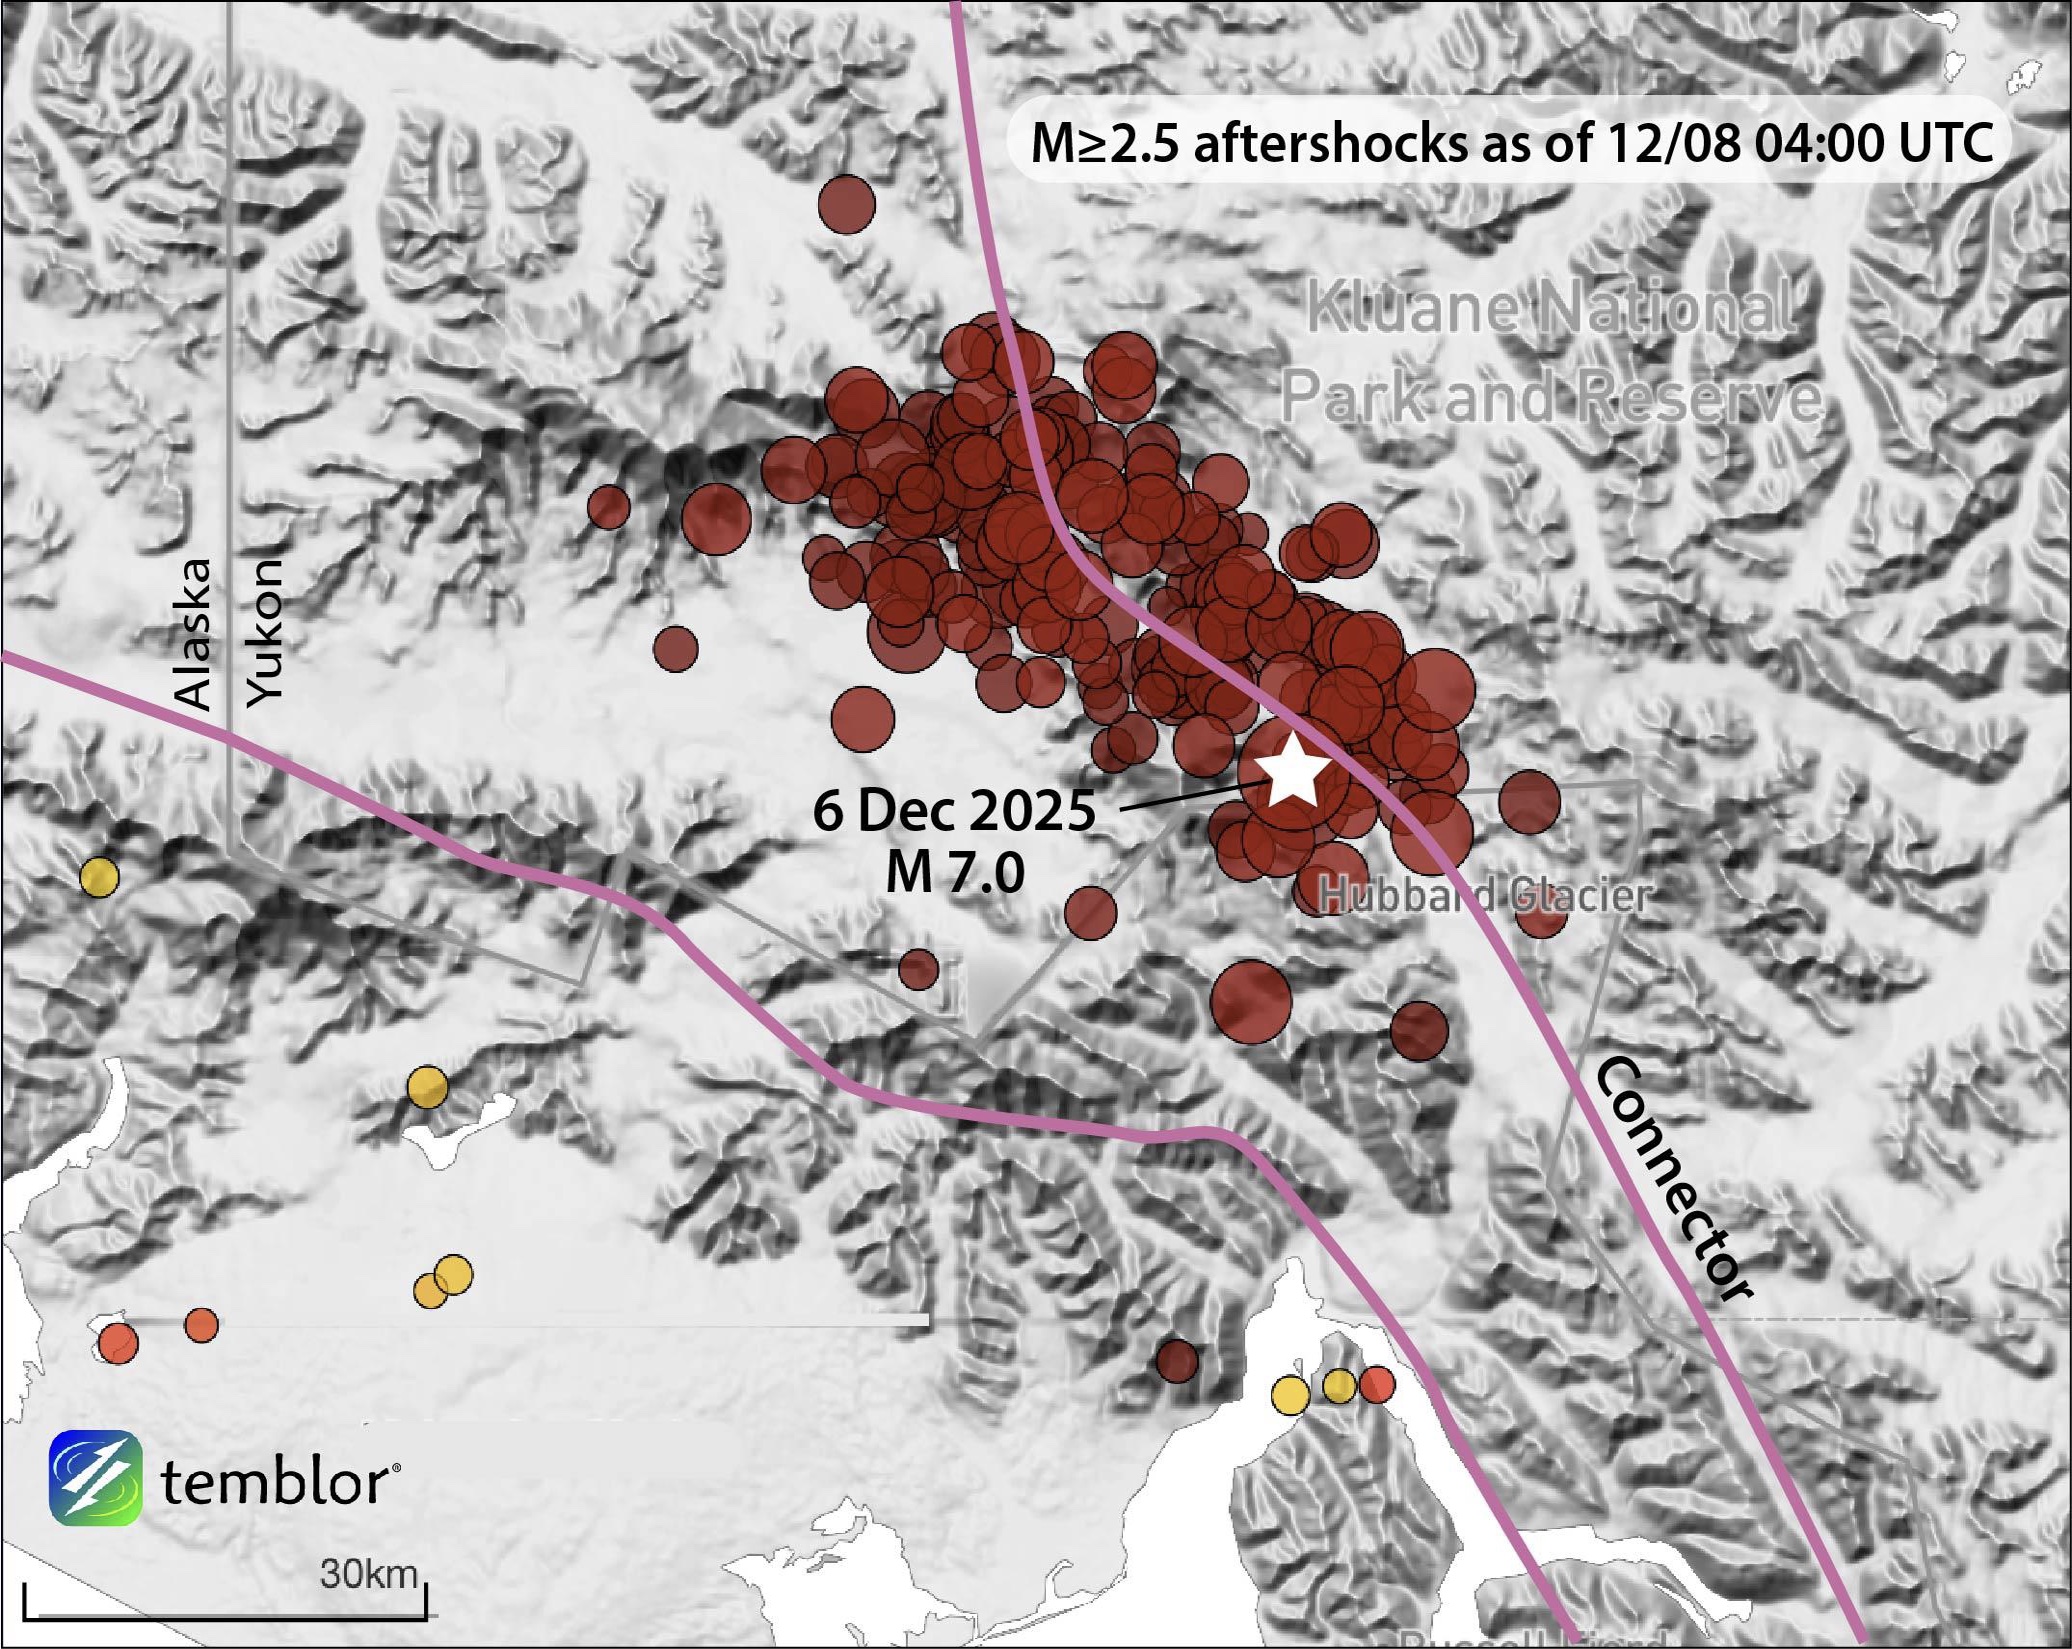
On December 6, 2025, a magnitude 7 earthquake struck along a fault that lies beneath Hubbard Glacier, located amid inhospitable mountainous terrain near the remote Alaska-Yukon border (Figure 1). As a result of the isolated epicenter, the earthquake was not widely felt and caused no damage. So, why should such a shock, regardless of its size, matter?
A newly discovered fault
The identification of the causative fault of this earthquake — the Connector Fault — during the past few decades is a signal accomplishment of academic and government geologists. Since 1970, seismologists had been hunting for a connection between the major active Totschunda Fault to the northwest and the Fairweather Fault 200 kilometers to the southeast.
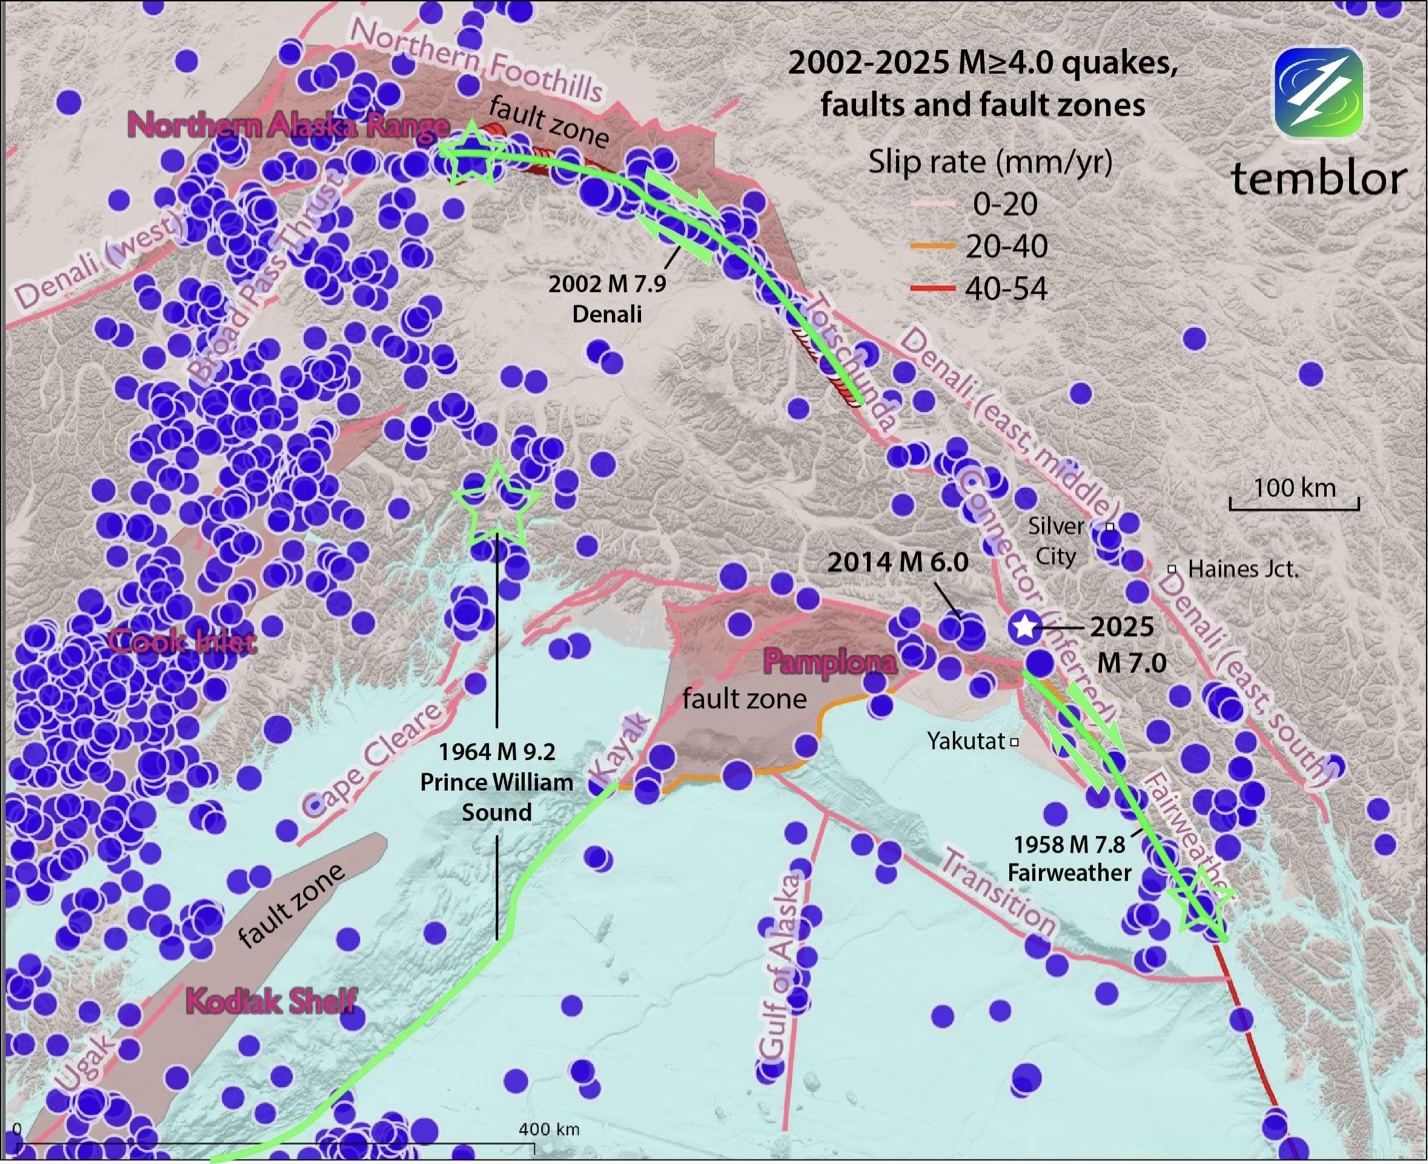
The Totschunda (as well as the western Denali Fault) ruptured in the 2002 magnitude 7.9 Denali earthquake (Eberhart-Philipps et al., 2003), and the Fairweather Fault ruptured in the 1958 magnitude 7.8 shock (Rollins et al., 2021) (Figure 2). These faults closely resemble the San Andreas in sense of slip, slip rate, and the size of the associated earthquakes. It would be almost impossible for 200 kilometers of the San Andreas to be unknown. But in Alaska, fault discovery is much harder due to geographic inaccessibility and glacier-filled valleys that cover the fault traces.
The Connector Fault’s 50-year discovery
Art Grantz (Grantz, 1966) mentioned a possible Denali Fault-Fairweather Fault connection. Richter and Matson (1971) then proposed a possible connection between the Totschunda and Fairweather faults. Lahr and Plafker (1980) included a “Totschunda-Fairweather connecting fault” in their kinematic block model, which the influential George Plafker later elaborated at several conferences.
In 2008, Kalbas et al. proposed that the region between the Totschunda and Fairweather faults should be called the Tot-Fair Fault, although “Connector” had also been in use. Analyses of the GPS-derived strain rate (Freymueller et al., 2008; Elliott et al., 2010; Elliot et al., 2013) and seismicity (Doser, 2014) greatly strengthened the case for the fault and clarified its slip rate. Subsequent research by Bender and Haeussler (2021), Biegel et al. (2024), and Haeussler et al. (2025) led to its inclusion as a seismic source in the 2023 USGS seismic hazard model for Alaska (Powers et al., 2024). This means that models the USGS uses to forecast the strength of shaking across the U.S. included this fault as a source, leading to more realistic assessments of the potential for strong shaking.
How likely was this shock?
Temblor’s seismic hazard model is based not on faults, but rather on a blend of strain rate measured by GPS and the past 120 years of earthquakes. Ideally, this alternative approach should yield results similar to that of the USGS, and unlike the USGS model, can be consistently applied worldwide, where fault inventories are often inadequate.
Our model gives a 50/50 chance over a typical human lifetime of about 85 years for a shock with a magnitude greater than or equal to 6.8 striking at the location of the Dec. 6 event. So, a magnitude 7.0 shock would have a rough recurrence time of about 100 to 150 years.
From this standpoint, the occurrence of the magnitude 7.0 shock is not surprising. Some 45 kilometers to the west of the magnitude 7.0 shock, a magnitude 6.0 event struck in 2014, another indication of the region’s high seismic potential.
Biegel et al. (2024) relocated earthquakes to gain a high resolution image of the Connector and associated faults (Figure 3). What emerged is a jumble of seismicity with many apparent orientations, which they interpreted as short fault segments with many orientations within a broad zone. Interestingly, the sense of slip of the larger quakes is consistent with the magnitude 7.0 shock, which has components of right-lateral shear as well as compression.
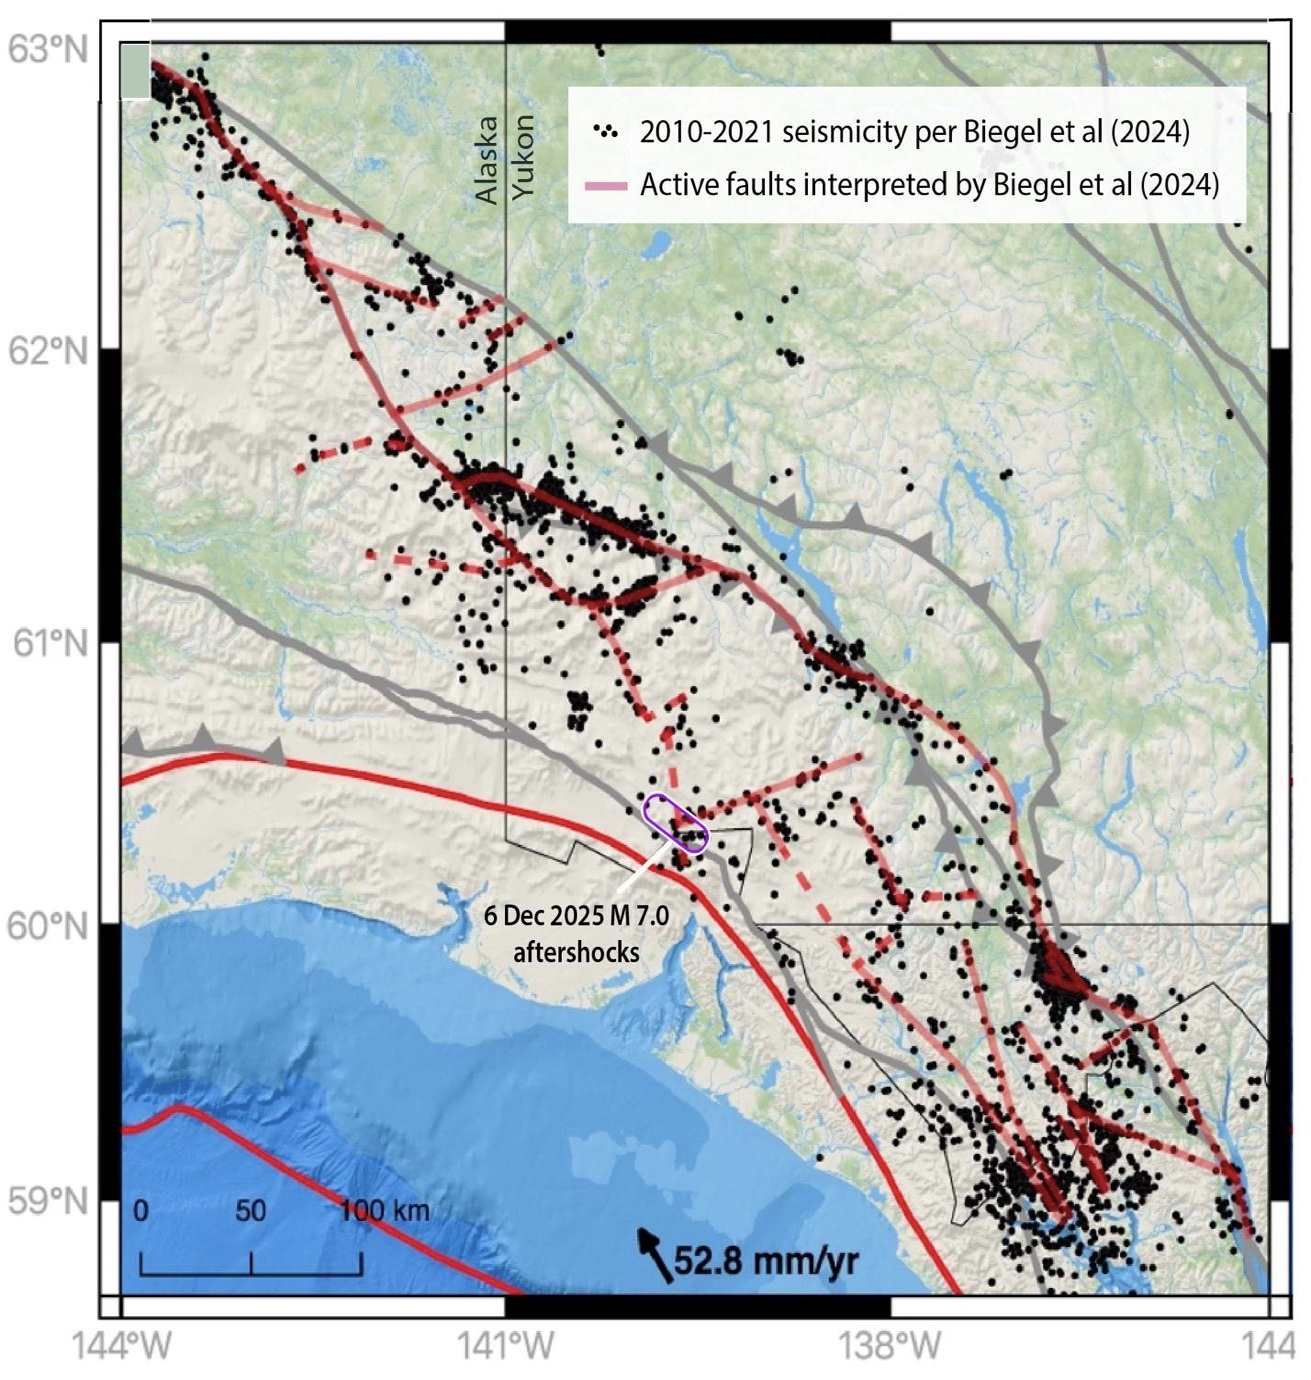
Although the Biegel et al. interpretation is possible, the Connector Fault could instead be simpler and more continuous than can be inferred from seismicity alone, as suggested by the occurrence of the Dec. 6 magnitude 7.0 shock parallel to the main fault trend.
Did previous earthquakes promote this shock?
We must consider whether the 1958 magnitude 7.8 and the 2002 magnitude 7.9 earthquakes played a role in making the recent earthquake more likely.
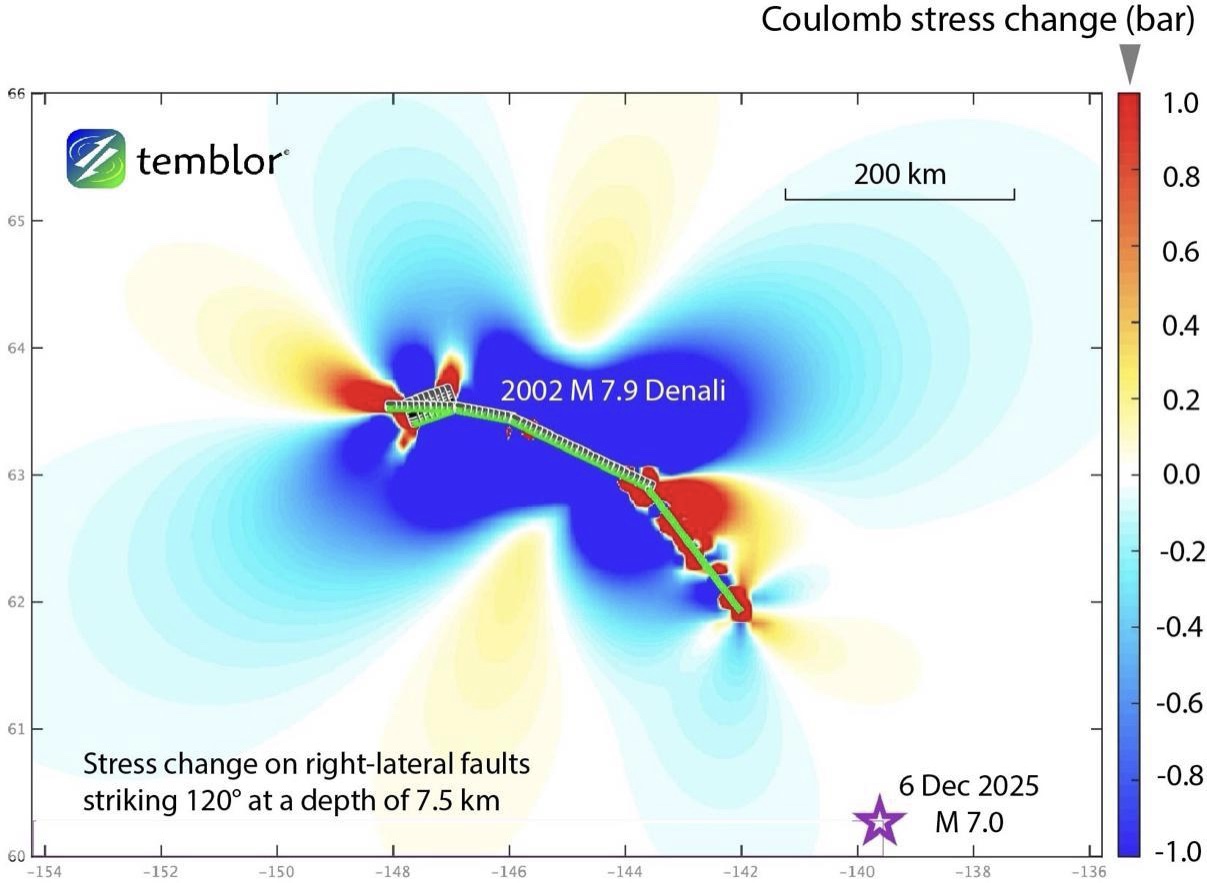
We can nearly rule out promotion by the 2002 Denali shock because its southeastern tip lies 200 kilometers from the 2025 magnitude 7.0 event. Our calculations suggest the stress change there was too small to change seismicity rates (Figure 4).
On the other hand, much-delayed promotion by the 1958 Fairweather earthquake is possible because the magnitude 7.0 shock lies only about 30 kilometers north of the Fairweather Fault tip, where the stress increase was probably closer to 1 bar. But if this were the case, why the 67-year delay? In general, we would expect aftershocks near the fault tips to persist for about 30 to 50 years.
Aftershocks and future mainshocks
The aftershock zone is about 50 kilometers long, with the largest aftershock as of Dec. 8 being a magnitude 5.8 earthquake. Both of these features — the aftershock length and the largest aftershock magnitude — are typical for a magnitude 7.0 rupture with strike-slip and thrust components (Figure 5).
However, there remains a 150-kilometer-long unruptured section between the Connector and Totschunda faults, from the southern end of the 2002 magnitude 7.9 Denali rupture to the 2025 magnitude 7.0 rupture. If this unruptured section were to fail in a single event, it could produce a magnitude 7.5 shock.
South of the 2025 magnitude 7.0 earthquake, there is a 30-kilometer-long unruptured stretch to the Fairweather Fault, which could rupture in a single event of approximately magnitude 6.8.
Last word
Much of the fault trace for the Dec. 6 earthquake is hidden under glaciers. The region is so mountainous and remote that field mapping by geologists and the deployment of seismic and GPS stations is difficult.
Against all odds, geologists discovered a major 250-kilometer-long U.S. fault and built it into the current USGS seismic hazard assessment. This is a rare and welcome case where a major new fault was detected before the mainshock, rather than afterward.
Reviewers: Dr. Jeffrey Benowitz, Ph.D. and Dr. Jeffrey Freymueller, Ph.D.
Science Editor: Dr. Alka Tripathy-Lang, Ph.D.
References
Alaska Science Center, U.S. Geological Survey (2021). Geologic Inputs for the 2023 Alaska Update to the U.S. National Seismic Hazard Model (NSHM). Metadata Updated: November 27, 2025.
Bender, A. M., and Haeussler, P. J. (2021). Alaska Fault Trace Mapping, 2021, Data Release, doi: 10.5066/P9H02FXB.
Biegel, K. M., Gosselin, J. M., Dettmer, J., Colpron, M., Enkelmann, E., and Caine, J. S. (2024). Earthquake relocations delineate a discrete fault network and deformation corridor throughout southeast Alaska and southwest Yukon, Tectonics, 43, e2023TC008140, https://doi.org/10.1029/2023TC008140.
Doser, D. I. (2014), Seismicity of Southwestern Yukon, Canada, and its relation to slip transfer between the Fairweather and Denali fault systems, Tectonophysics, 611, 121-129, doi.org/10.1016/j.tecto.2013.11.018
Doser, D. I., Pelton, J. R., and Veilleux, A. M. (1997). Earthquakes in the Pamplona zone, Yakutat block, south central Alaska, J. Geophys. Res., 102(B11), 24499–24511, doi:10.1029/97JB01729.
Eberhart-Phillips, D., et al. (2003). The 2002 Denali Fault Earthquake, Alaska: A large magnitude, slip-partitioned event, Science, 300, 1113, doi: 10.1126/science.1082703.
Elliott, J. L., C. F. Larsen, J. T. Freymueller, and R. J. Motyka (2010), Tectonic block motion and glacial isostatic adjustment in southeast Alaska and adjacent Canada constrained by GPS measurements, J. Geophys. Res., 115, B09407, doi:10.1029/2009JB007139.
Elliott, J., J. T. Freymueller, and C. F. Larsen (2013), Active tectonics of the St. Elias orogen, Alaska, observed with GPS measurements, J. Geophys. Res., 118, 5625–5642, doi:10.1002/jgrb.50341.
Freymueller, J.T., H. Woodard, S.C. Cohen, R. Cross, J. Elliott, C.F. Larsen, S. Hreinsdóttir, and C. Zweck (2008), Active deformation processes in Alaska, based on 15 years of GPA measurements, in Active Tectonics and Seismic Potential of Alaska, Geophysical Monograph Series 79, American Geophysical Union, doi.org/:10.029/79GM02
Grantz, A. (1966), Strike-slip faults in Alaska, U.S. Geol. Surv. Open-File Rep. 66-53, 82 p.
Haeussler, P. J., Bender, A. M., Powers, P. M., Koehler, R. D., and Brothers, D. S. (2025). Updating the Crustal Fault Model for the 2023 National Seismic Hazard Model for Alaska in Tectonics and Seismic Structure of Alaska and Northwestern Canada: EarthScope and Beyond, Geophysical Monograph 290, edited by Ruppert, N. A., Jadamec, M. A., and Freymueller, J. T., American Geophysical Union.
Kalbas, J. L., Freed, A. M., and Ridgway, K. D. (2008). Contemporary fault mechanics in southern Alaska, in Geophysical Monograph Series, edited by Freymueller, J. T., Haeussler, P. J., Wesson, R. L., and Ekström, G., pp. 321–336, American Geophysical Union, https://doi.org/10.1029/179GM18.
Lahr, J. C., and G. Plafker (1980), Holocene Pacific-North American plate interaction in southern Alaska: Implications for the Yakataga seismic gap, Geology, 8, 483–486, doi:10.1130/0091-7613(1980)8<483:HPAPII>2.0.CO;2.
Powers, P. M., Altekruse, J. M., Llenos, A. L., Michael, A. J., Haynie, K. L., Haeussler, P. J., Bender, A. M., Rezaeian, S., Moschetti, M. P., Smith, J. A., Briggs, R. W., Witter, R. C., Mueller, C. S., Zeng, Y., Girot, D. L., Herrick, J. A., Shumway, A. M., and Petersen, M. D. (2024). The 2023 Alaska National Seismic Hazard Model, Earthquake Spectra, 40(4), 2545–2597, https://doi.org/10.1177/87552930241266741.
Richter, D.H., and N.A. Matson, Jr. (1971), Quaternary Faulting in the Eastern Alaska Range. GSA Bulletin, 82, 1529–1540. doi: https://doi.org/10.1130/0016-7606(1971)82[1529:QFITEA]2.0.CO;2
Rollins, C., Freymueller, J. T., and Sauber, J. M. (2021). Stress promotion of the 1958 Mw∼7.8 Fairweather Fault earthquake and others in southeast Alaska by glacial isostatic adjustment and inter-earthquake stress transfer, J. Geophys. Res., 126, e2020JB020411, https://doi.org/10.1029/2020JB020411.
Copyright
Text © 2025 Temblor. CC BY-NC-ND 4.0
We publish our work — articles and maps made by Temblor — under a Creative Commons Attribution-NonCommercial-NoDerivatives 4.0 International (CC BY-NC-ND 4.0) license.
For more information, please see our Republishing Guidelines or reach out to news@temblor.net with any questions.
- The Earthquake that Shook the South - February 26, 2026
- Introducing Coulomb 4.0: Enhanced stress interaction and deformation software for research and teaching - February 20, 2026
- Deep earthquake beneath Taiwan reveals the hidden power of the Ryukyu Subduction Zone - January 7, 2026