By David Jacobson, Temblor

According to year-end data from the Oklahoma Corporation Commission, there was a 23% drop from 2015 to 2016 in the amount of wastewater injected into the Arbuckle Group, which is located in the commission’s “areas of interest for triggered seismicity.” This value, which was reported by Tulsa World, is mostly complete, though a few companies have lagged behind. Nonetheless, there was a significant drop in 2016.
Wastewater disposal, according to USGS Research Geophysicist Justin Rubinstein is the process of drilling extremely deep wells into porous rock, into which wastewater is injected. Normally, this will not be a problem. However, the increased fluid pressure can allow the wastewater to find its way into faults. When this happens, the fault can be pried open making it easier for it to move.

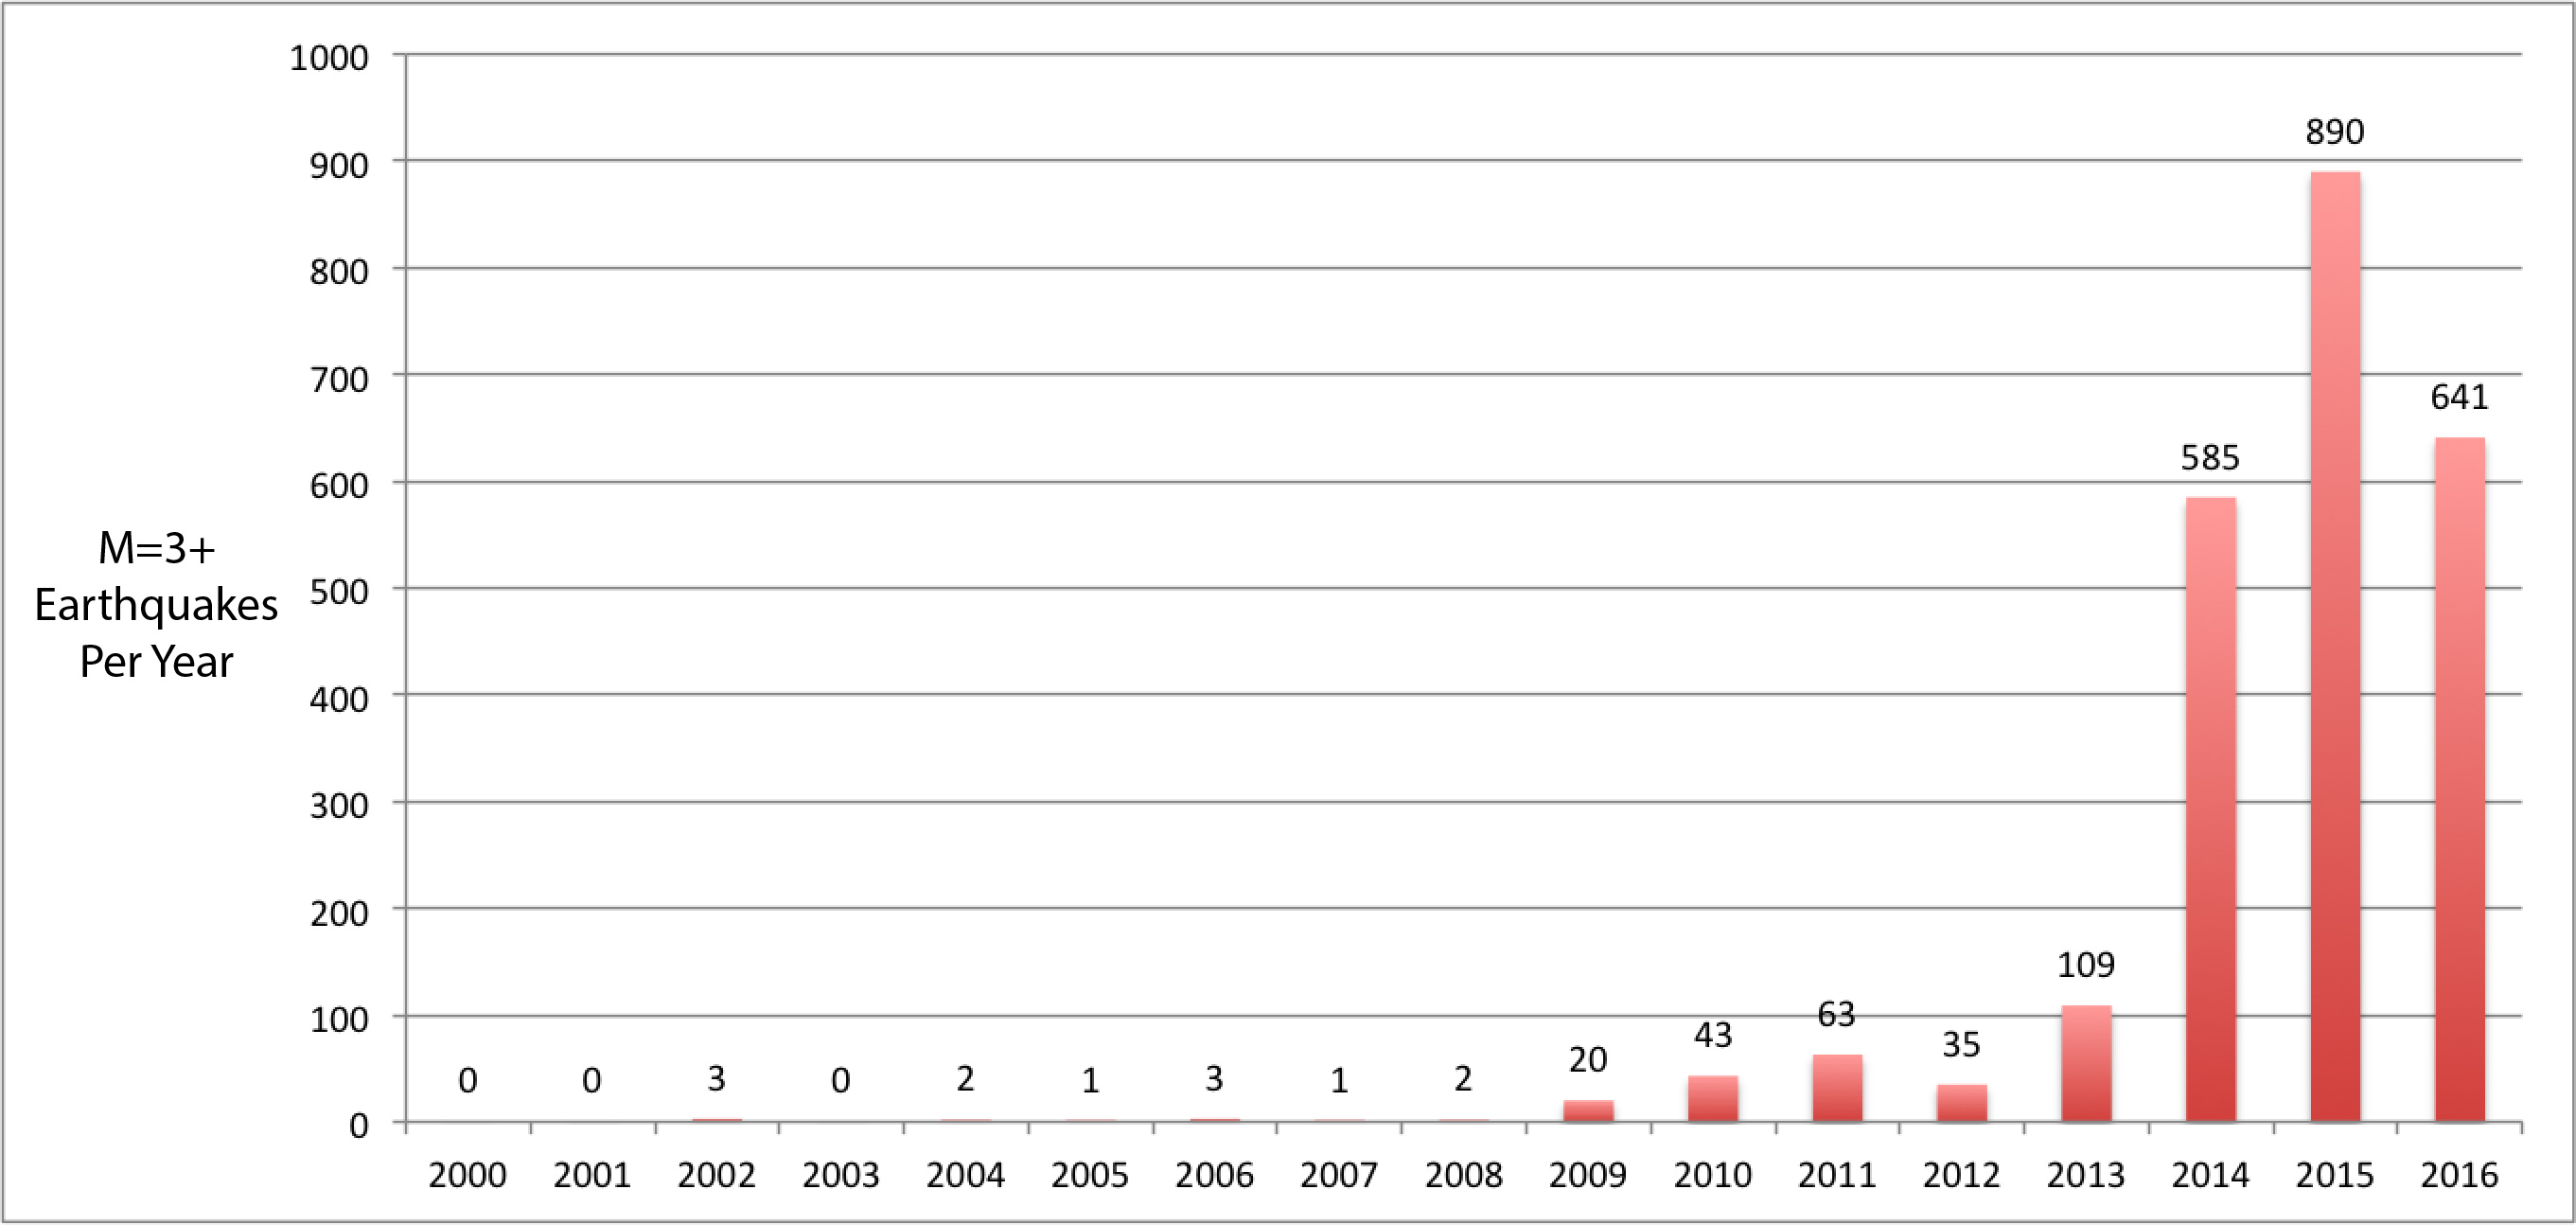
The amount of wastewater injected is of primary concern in Oklahoma as it is seen as a major contributor to induced earthquakes. From 2009-2014, there was a 181% increase in the amount of injection into the Arbuckle formation, which is located in a 15,000 square mile zone where the majority of the state’s earthquakes occur. This rise correlates extremely well to the substantial increase in earthquakes in Oklahoma (See graph below).
However, in 2016, several significant actions, starting in January, were taken to reduce the amount of wastewater disposal. Some of these actions included requiring wells to reduce the volume of disposal, or completely shutting wells altogether. The most widely reported of these actions were those taken following the 3 September 2016 M=5.8 Pawnee earthquake, the largest reported quake in the state’s history.
When it comes to earthquake statistics in 2016, there was a 28% drop in the number of M=3+ earthquakes in Oklahoma (From 890 in 2015, to 641 in 2016 according to the USGS). While there are likely many reasons for the decline in earthquakes, it is likely that one of them is the decrease in wastewater disposal.

Despite the fact that the total number of earthquakes decreased in 2016, there were several larger earthquakes, two of which caused damage. Those that caused damage were the 6 November M=5.0 Cushing, and 3 September M=5.8 Pawnee quakes. These, combined with the 13 Feb M=5.1 Fairview earthquake are three of the four largest quakes in Oklahoma since 2009.
While these earthquakes are relatively large, scientists are not sure if there is an upper limit to the size of induced earthquakes. Studies have shown that prehistoric earthquakes in Oklahoma reached M=7, but those were obviously not man-made. Therefore, only time will tell what will happen in Oklahoma both in terms of earthquake magnitude and numbers.
Sources
Tulsa World
USGS
USGS August 27, 2015 lecture: “Yes, Humans Really Are Causing Earthquakes”
Washington Post
Murray, Kyle, Class II Saltwater Disposal for 2009–2014 at the Annual, State, and County Scales by Geologic Zones of Completion, Oklahoma. Open-File Report (OF5-2015).
Oklahoma Corporation Commission
- Earthquake science illuminates landslide behavior - June 13, 2025
- Destruction and Transformation: Lessons learned from the 2015 Gorkha, Nepal, earthquake - April 25, 2025
- Knock, knock, knocking on your door – the Julian earthquake in southern California issues reminder to be prepared - April 24, 2025