By David Jacobson (Temblor), Ross Stein (Temblor), and Professor Shinji Toda (IRIDeS, Tohoku University, Japan)

A third large quake rattles Mexico
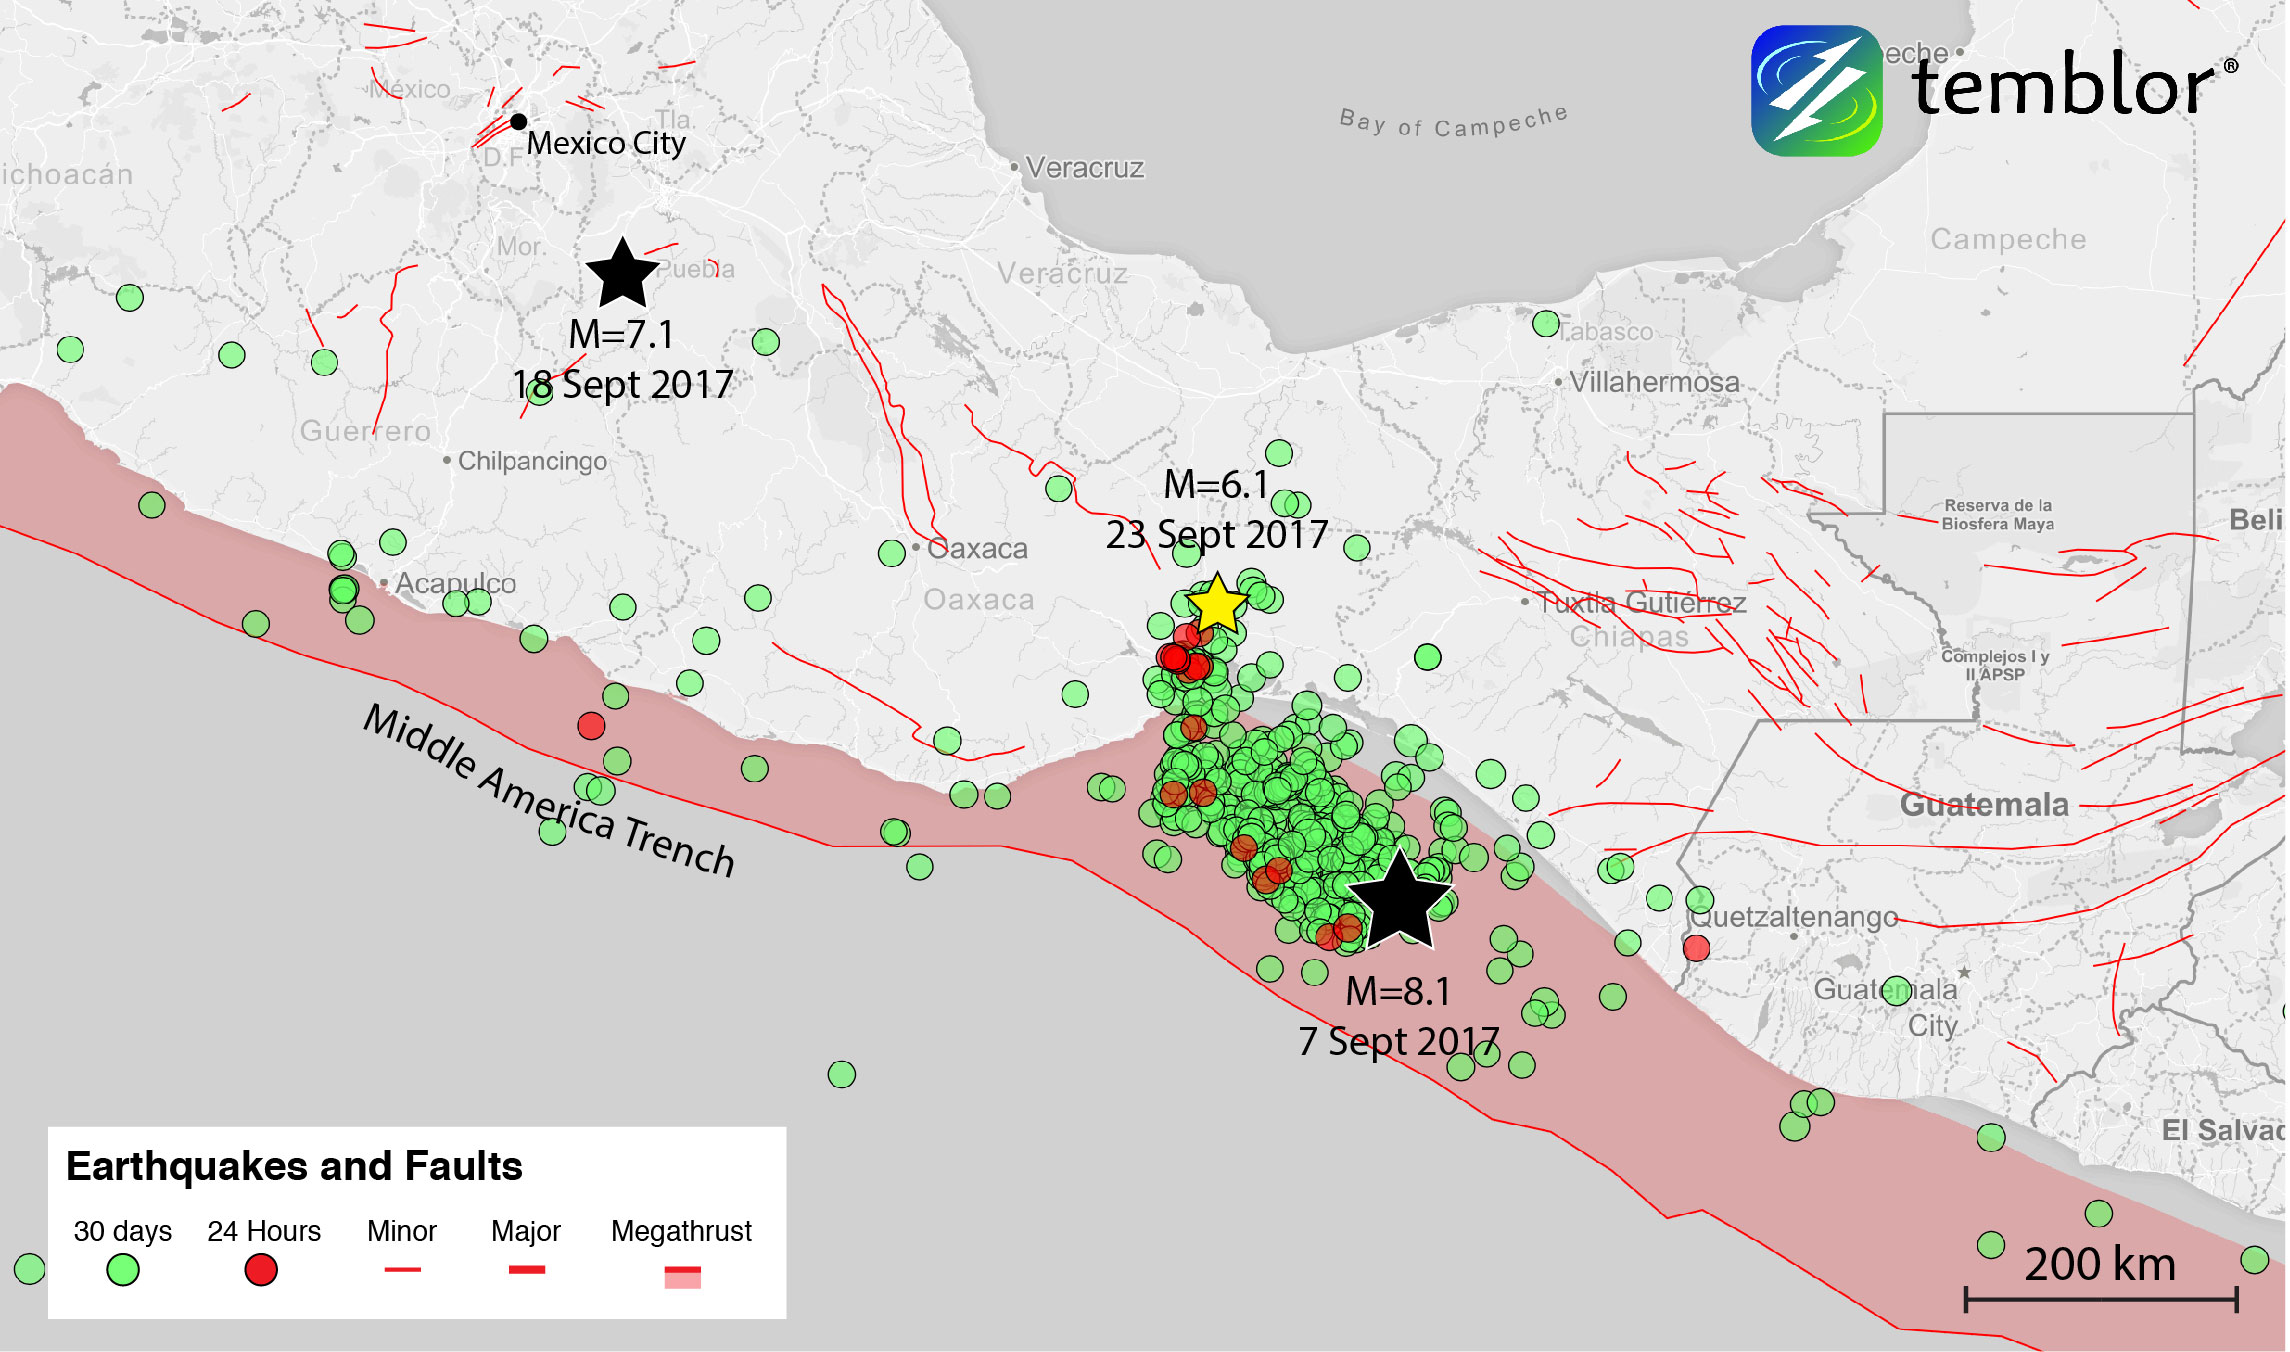
Over the weekend, a M=6.1 earthquake struck Oaxaca, Mexico, the third M=6+ earthquake to shake the country in less than three weeks. This series of unfortunate events kicked off on September 7 when a M=8.1 off the coast of Chiapas collapsed buildings but fortunately resulted in under 100 fatalities. Then, twelve days later, on September 19, the M=7.1 Puebla earthquake shook Mexico City, resulting in nearly 300 casualties and dozens of collapsed buildings around the capital. Fortunately, this most recent M=6.1 earthquake did not cause the damage or fatalities its predecessors did. Additionally, while the earthquake did briefly suspend rescue efforts in Mexico City, upon discovering that no building suffered additional damage, the search for survivors from the Puebla quake continued immediately. While last week we used Coulomb stress analysis to show that the Chiapas and Puebla were not obviously related, the opposite is the case for the most recent M=6.1 earthquake and the M=8.1 Chiapas earthquake on September 7.
In the figure below, Coulomb stress calculation done by Professor Shinji Toda at IRIDeS, Tohoku University, Japan shows that the stress imparted by the M=8.1 Chiapas earthquake brought the fault that ruptured in the M=6.1 quake significantly closer to failure. In this figure, warmer colors correspond to areas of increased stress in the calculation, while cooler colors represent regions where stress has been relieved. The stresses are resolved on the orientation and sense of slip of the fault that ruptured in the M=6.1 shock. This means that in red areas, aftershocks are more likely, while in blue areas, they are less likely. While not within the darkest red, the M=6.1 earthquake over the weekend struck in a region that experienced a stress increase of approximately 0.5 bars. Stress changes of >0.1 bars are generally found to promote aftershocks, and so the increase seen in the location of Saturday’s M=6.1 is five times above the observable threshold. So, in our view, the M=6.1 aftershock was strongly promoted by the M=8.1 Chiapas mainshock. To get a sense of what 0.5 bars corresponds to, see the figure below of Ross Stein. By pressing your palms across each other at the correct angle you too can generate 0.5 bars of Coulomb stress. Its remarkable that such a small stress increase, when applied over a large fault surface, is sufficient to trigger an earthquake. The quake itself will typically drop the stress by about 30 bars, and so 0.5 bar represents a 1-2% increase in the stress that drives rupture.


Another important point brought up by Professor Toda is that the occurrence of this M=6.1 earthquake demonstrates that the M=8.1 earthquake triggered several types of aftershocks. The M=8.1 earthquake off the Chiapas coast was an ‘intraslab’ event, meaning it struck within the subducting Cocos plate beneath the North American plate. Many of the ensuing aftershocks also occurred within the slab. However, Saturday’s quake was much shallower (9 km or 5 mi depth) meaning it was a crustal event within the overriding North American plate. This means that in addition to triggering other slab events, the Chiapas quake on September 7, sufficiently stressed crustal faults.
The M=6.1 is part of the aftershock sequence of the Chiapas mainshock
Even though it has been almost three weeks since the Chiapas earthquake, aftershocks such as the M=6.1 over the weekend come as no surprise. In fact, aftershocks are the most predictable quakes in a very simple way: Their frequency decays with inverse time (1/time). This means that the number of aftershocks during the first day will be about the same as the number in the next 10 days, which will be same as the number in the next 100 days, which will be the same as the next 1,000 days, etc. Additionally, the largest aftershock during the first day will be about the same magnitude as the largest during the next 10 days, which will be same as the largest in the next 100 days, which will be the same as the largest in next 1,000 days.
So, aftershocks do not get smaller with time, they just get stretched out in time. There is also a 1-10% chance (depending on where you are) that an aftershock will be larger than it’s mainshock. This means that we can continue to expect moderate to large magnitude aftershocks around Chiapas, and that there is a small possibility that an even larger quake could hit the already recovering nation.
References
USGS
Shinji Toda, Ross S. Stein, Volkan Sevilgen, and Jian Lin, Coulomb 3.3 Graphic-Rich Deformation and
Stress-Change Software for Earthquake, Tectonic, and Volcano Research and Teaching—User Guide, USGS Open-File Report 2011–1060 Click here for USGS Open–File Report
- Earthquake science illuminates landslide behavior - June 13, 2025
- Destruction and Transformation: Lessons learned from the 2015 Gorkha, Nepal, earthquake - April 25, 2025
- Knock, knock, knocking on your door – the Julian earthquake in southern California issues reminder to be prepared - April 24, 2025