By David Jacobson, Temblor

M=4.0 earthquake south of Portland
Last night, at 5:24 p.m., a M=4.0 earthquake struck just south of Portland near the small town of Molalla, and registered over 4,000 felt reports on the USGS website. While this quake was not large enough to cause any damage, only light shaking near the epicenter, it occurred in almost the exact same spot as a M=5.6 in 1993. That quake, known as the “Spring break quake,” resulted in toppled chimneys and some damage to unreinforced masonry buildings. The cost of damage in that quake reached $28 million, and 6 people were injured.
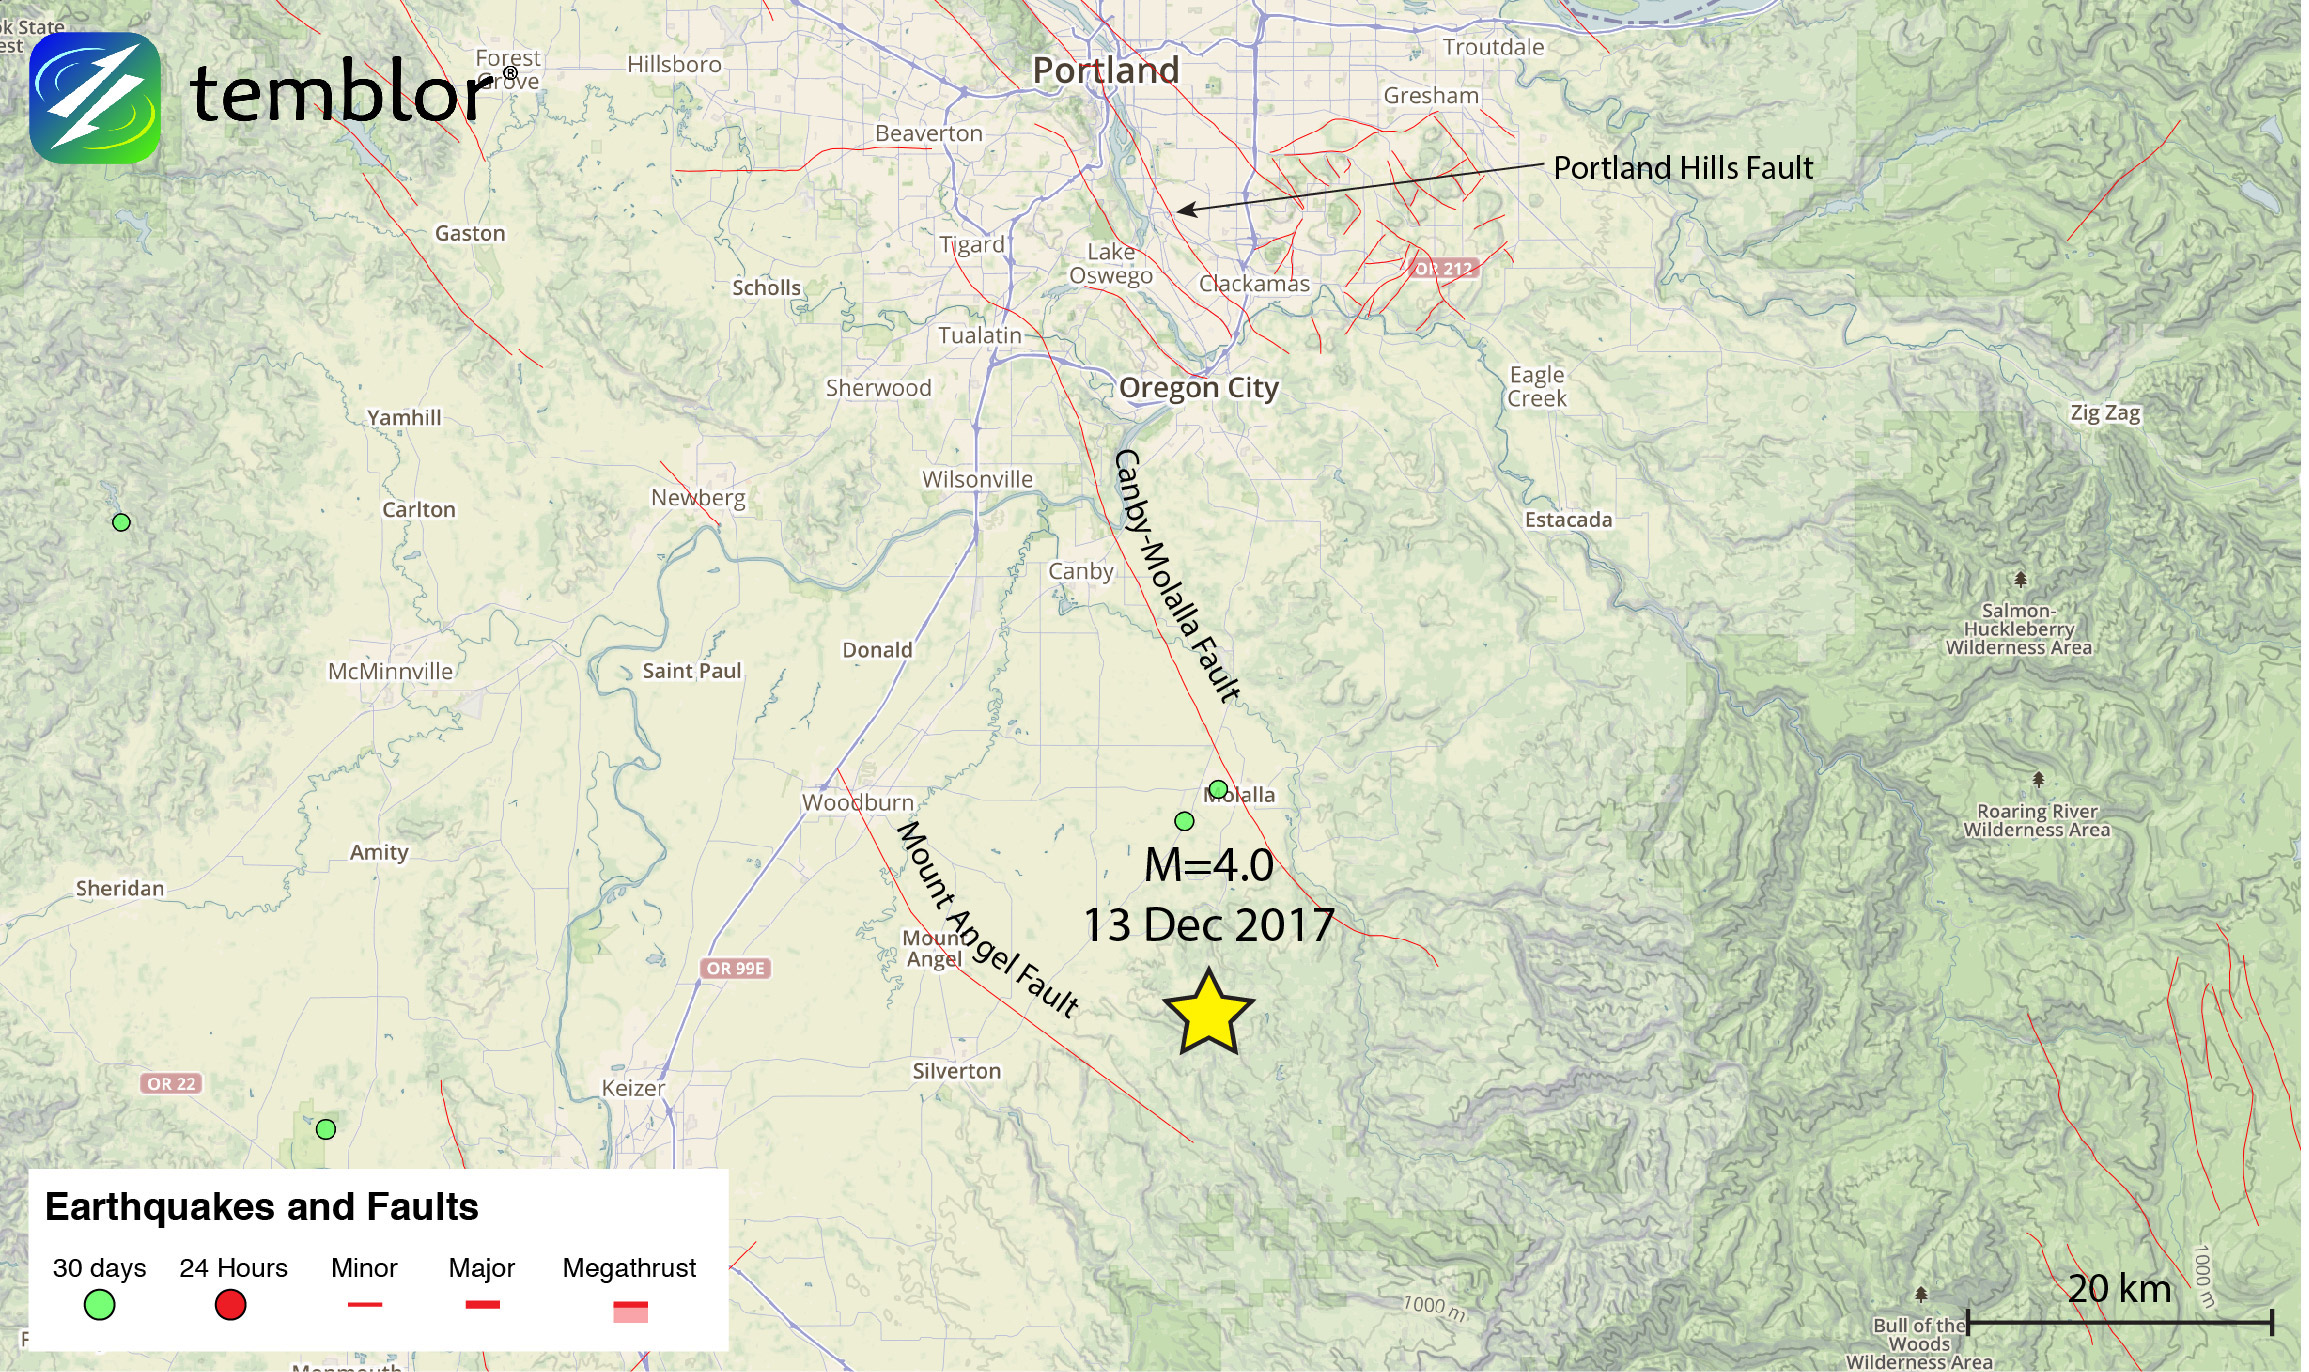
Even though the USGS does not have a focal mechanism for last night’s earthquake, it likely had components of both right-lateral strike-slip and compressional motion based on its proximity to the epicenter of the 1993 quake (approximately 500 m away). In terms of the active faults in this area, the two major ones are the Canby Molalla and Mount Angel faults. The Mount Angel Fault likely ruptured in the 1993 earthquake, and is part of a 50 km-long stretch of discontinuous faults. This structural zone, combined with the Canby-Molalla and Portland Hills faults is part of a larger system of strike-slip faults that pose a threat to the city of Portland and make up the northern margin of the Willamette Valley.
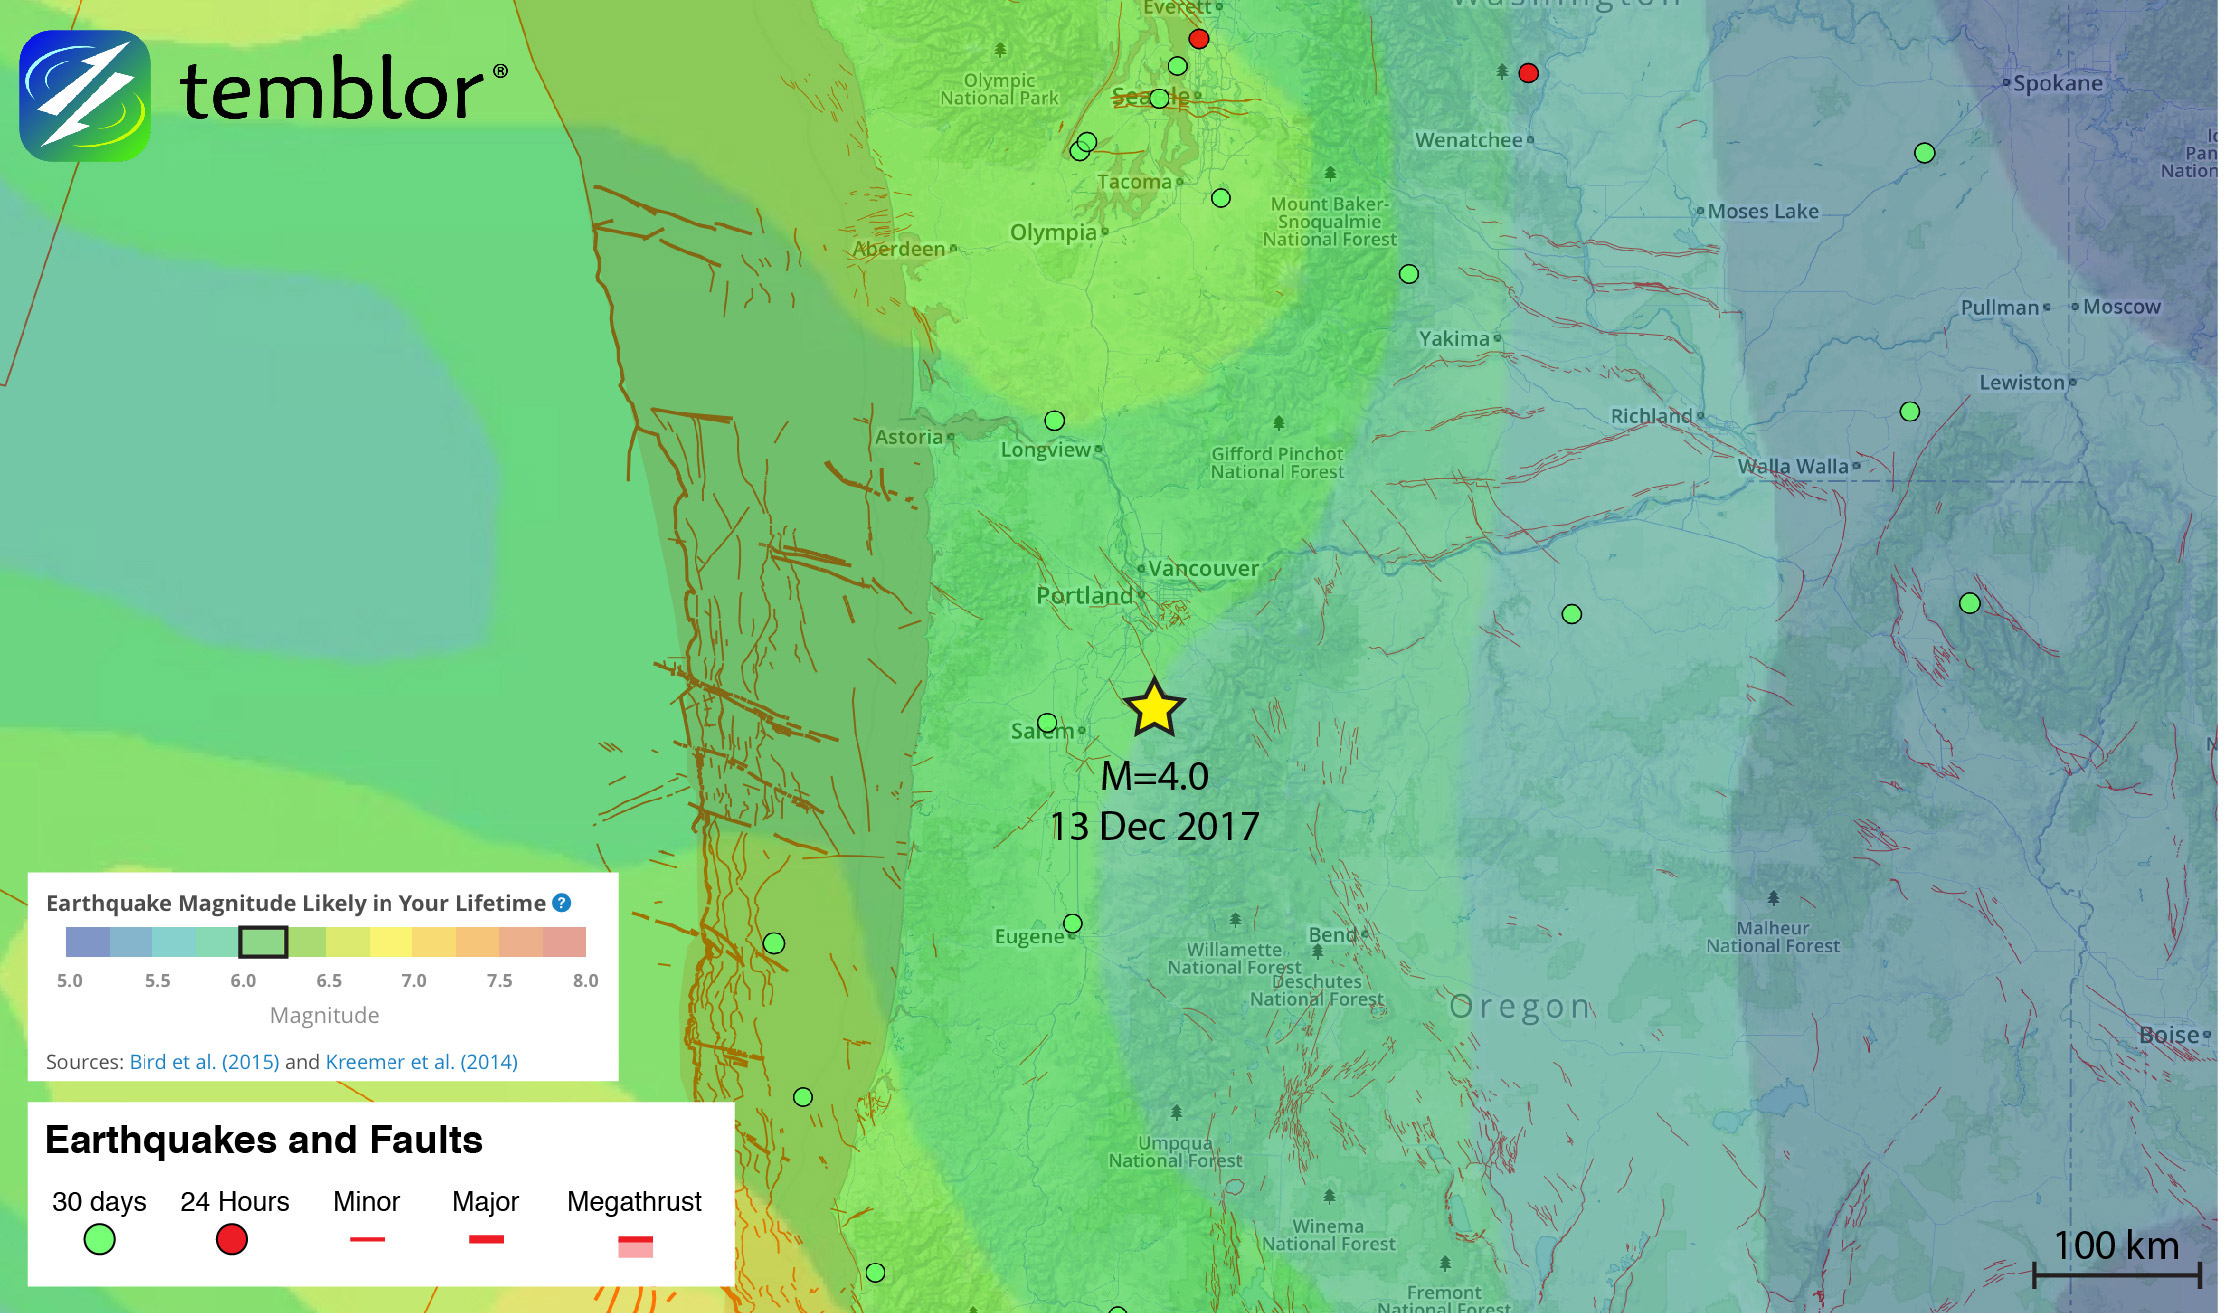
While last night’s M=4.0 event may not have been large enough to cause any damage, it does provide a reminder that people in Oregon are at risk of earthquakes. In fact, the USGS does have a scenario event for the Mount Angel Fault, in which they suggest a M=6.8 event is possible. This highlights the fact that while the offshore Cascadia Subduction Zone does pose a major threat to the region, there are smaller crustal faults which also threaten populated areas. This is further validated by looking at the Global Earthquake Activity Rate (GEAR) model, which suggests that in the area around last night’s earthquake, a M=6+ earthquake is likely to occur in your lifetime. To view the model, click here.
Tremor picks up in Central Oregon
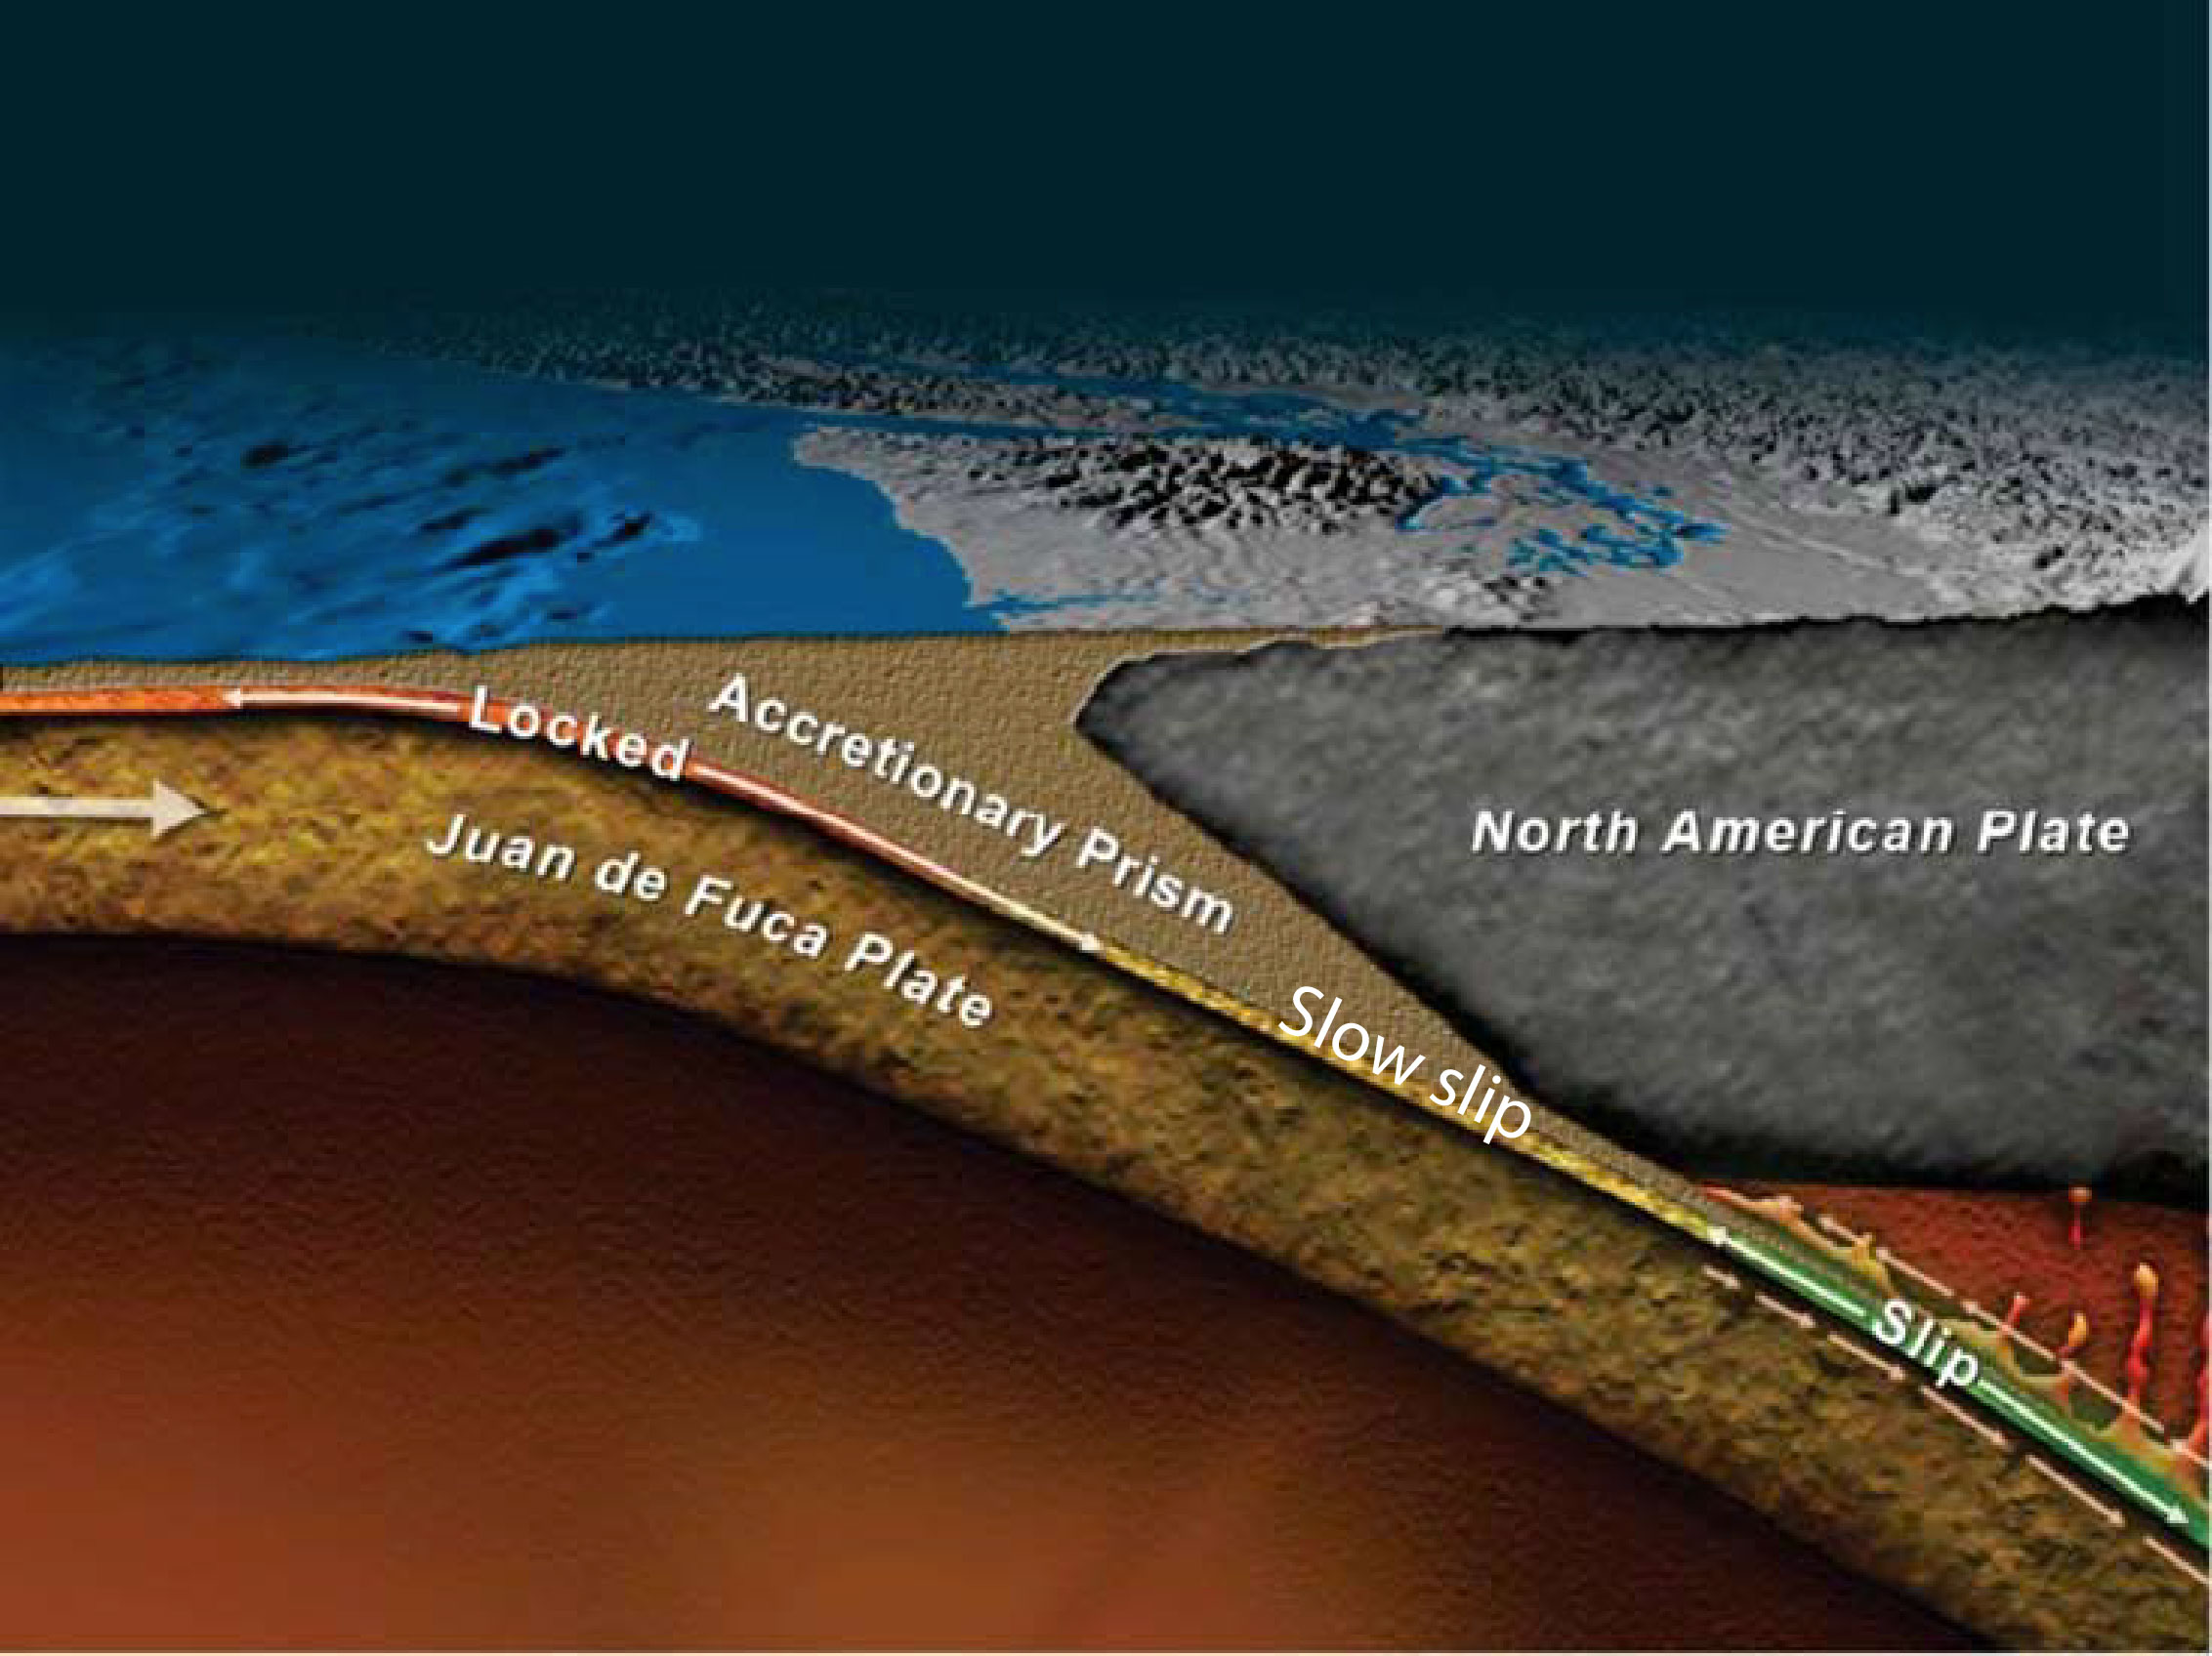
Unrelated to last night’s M=4.0 earthquake is the fact that in Central Oregon, tremor is picking up after a 22 month period of quiescence. This occurrence, first reported by the Pacific Northwest Seismic Network, highlights a period of slow slip along the Cascadia Subduction Zone (To view an interactive tremor map from the Pacific Northwest Seismic Network, click here). What is important to point out is that slow slip events are not like regular earthquakes. When most people think of earthquakes, they think of shaking for seconds to minutes. However, slow slip events are characterized by tremor, which can last for days to weeks. Tremor is defined as high frequency vibration that does not have the same initial onset seen in regular earthquakes. Tremor is also often accompanied by extremely slow surface deformation, suggesting slip occurs simultaneously.

While this slip along the Cascadia Subduction Zone is termed as “rapid,” it is still much slower than what is experienced during normal earthquakes. However, it is more rapid than what normally occurs along Cascadia. In most places along the subduction zone, slip is approximately 4cm/yr. However, locking periodically occurs, and is followed by these slow slip events.
Slow slip events are also unique because of the zone in which they take place. From the earth’s surface to a depth of 35 km, the Cascadia Subduction Zone generally follows a pattern of locking for decades to millennia. These periods are separated by extremely rapid slip in catastrophic earthquakes that can exceed magnitude 9. However, slow slip events typically take place from 35-55 km depth, below which the plate motion is believed to be “smooth and constant.” Therefore slow slip appears to take place in a bit of a transition zone where there is both locking and steady slip for week-long periods. Because of this, the stress released in slow slip events is substantially lower than in regular earthquakes. For reference, last night’s M=4.0 quake south of Portland occurred at a depth of 17 km, meaning it was a mid-crustal event.
As was mentioned earlier, this slow-slip event comes after 22 months of silence. According to the Pacific Northwest Seismic Network, this part of Oregon experiences a slow-slip event about every two years. So, you could say that this is not unexpected. Nonetheless, it gives geologists another opportunity to study this phenomenon.

One question that often arises with slow slip events is whether they can be used to interpret the threat of large subduction zone earthquakes. While it is possible, at this stage scientists are unsure. Nonetheless, significant research is focusing on this phenomenon to see if slow slip events are a key to unlocking where large earthquakes could occur.
References
USGS
Pacific Northwest Seismic Network
John E. Vidale and Heidi Houston, Slow slip: A new kind of earthquake, January 2012, Physics Today
- Earthquake science illuminates landslide behavior - June 13, 2025
- Destruction and Transformation: Lessons learned from the 2015 Gorkha, Nepal, earthquake - April 25, 2025
- Knock, knock, knocking on your door – the Julian earthquake in southern California issues reminder to be prepared - April 24, 2025