Check your risk with the Temblor App
By Alka Tripathy-Lang, Ph.D. (Berkeley Geochronology Center, Calif.)
Previous research suggests that not until halfway through the rupture—90 seconds for an M=9 shock—can one predict its magnitude, but new findings could bring this down to 10-15 sec, which would greatly extend and enhance Earthquake Early Warnings.
- Includes Comments and Replies
Citation: Tripathy-Lang A. (2019), Can the size of a large earthquake be foretold just 10 seconds after it starts?, Temblor, http://doi.org/10.32858/temblor.029
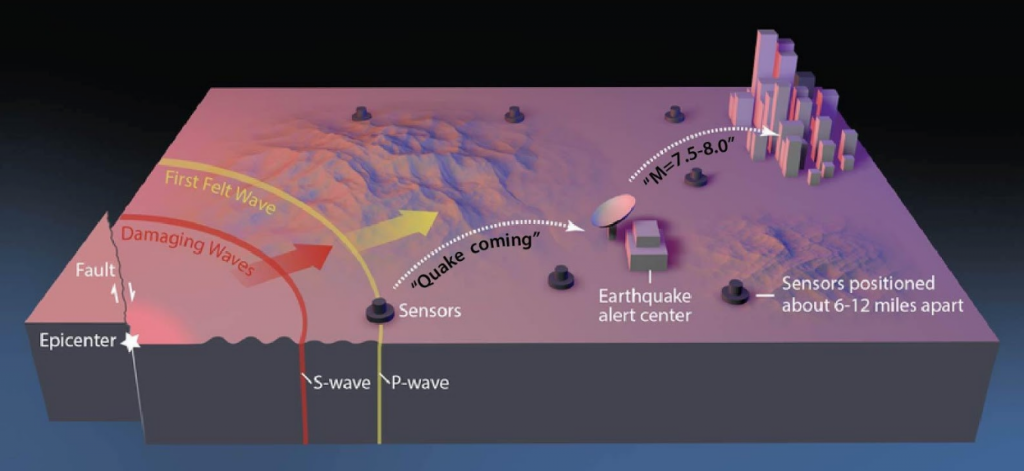
When the massive magnitude-9.1 earthquake rocked the seafloor off the coast of Tohoku, Japan, in March 2011, the Japanese Earthquake Early Warning System sent alerts to locations that were predicted to shake at or above a level 5 on Japan’s shaking intensity scale, which should have provided tens of seconds of warning. While warnings issued near the epicenter of the earthquake saved lives, places like the greater Tokyo region received no warning because the predicted intensities were underestimated (Cryanoski, 2011). A more accurate prediction of the earthquake magnitude in the seconds after rupture began might have improved earthquake and tsunami predictions, which could have saved more lives. Scientists say that one approach to improving early estimates of earthquake magnitude is to answer a question that has plagued them for years:
When does a large earthquake know how large it will become?
Now, they may have an answer. Seismologists Diego Melgar of the University of Oregon and Gavin Hayes of the U.S. Geological Survey (USGS) in Golden, Colo., tackled this question by chance while Melgar was working on another project — writing code to simulate earthquakes to check the accuracy of Earthquake Early Warning systems in the Pacific Northwest. “I needed to know what the earthquakes should look like,” Melgar says.
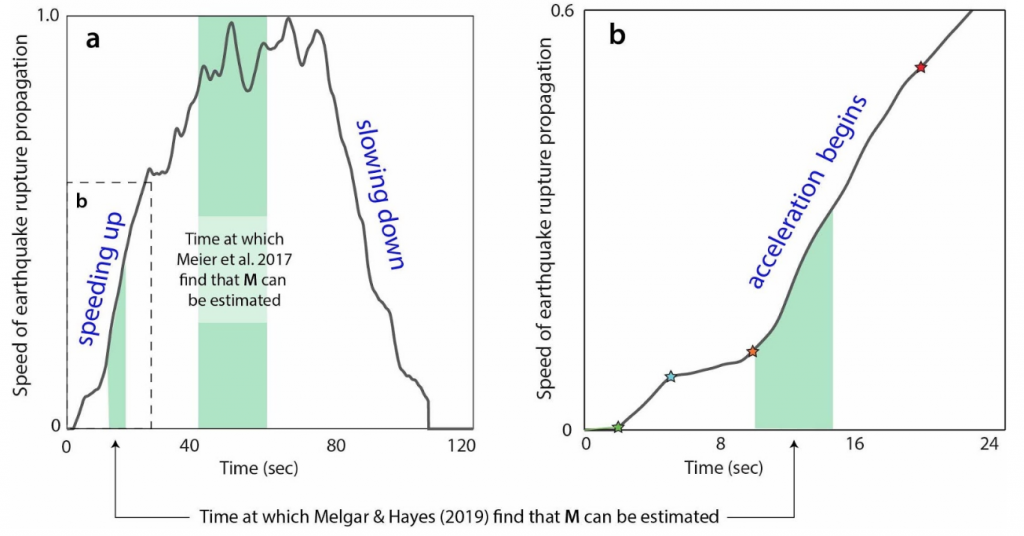
He reached out to Hayes, who curates a database for the USGS that contains “source time functions,” which show how the seismic energy release changes through time as the earthquake ruptures. The rupture does not expand at a single speed. Instead, as it grows, the speed of growth changes. The source time function captures that change. Now, think back to high school physics and recall that if you take the slope of speed, you are calculating acceleration or deceleration. That’s what Melgar and Hayes did: They focused on the acceleration of the energy release in large (M>7) and great (M≥9) earthquakes.
Melgar and Hayes found that acceleration wobbled around (changed unpredictably) between 2 and 5 seconds after the start of the quakes. However, with the approximately 250 M≥7 earthquakes in their database, they found that between 10 and 15 seconds after rupture began, these larger earthquakes started to behave similarly, and that behavior scales with their final magnitude, Hayes says. “In other words, the acceleration at 10 to 15 seconds is diagnostic of their final magnitude.”
A crucial cross-check
Using three different source time function databases, Hayes notes, the pair found “the exact same signal.” This consistency, he adds, shows that that the predictable behavior of these large earthquakes between 10 and 20 seconds is not an artifact of database choice.
Unfortunately, Hayes says, “[a source time function] is not something we can compute in real time.” So, Melgar and Hayes needed to corroborate their finding of earthquake magnitude predictability after 10 to 15 seconds with a dataset collected close to the earthquake sources that exploit the 10- to 15-second window as soon as possible after the earthquake rupture begins, and well before earthquake rupture propagation is completed.
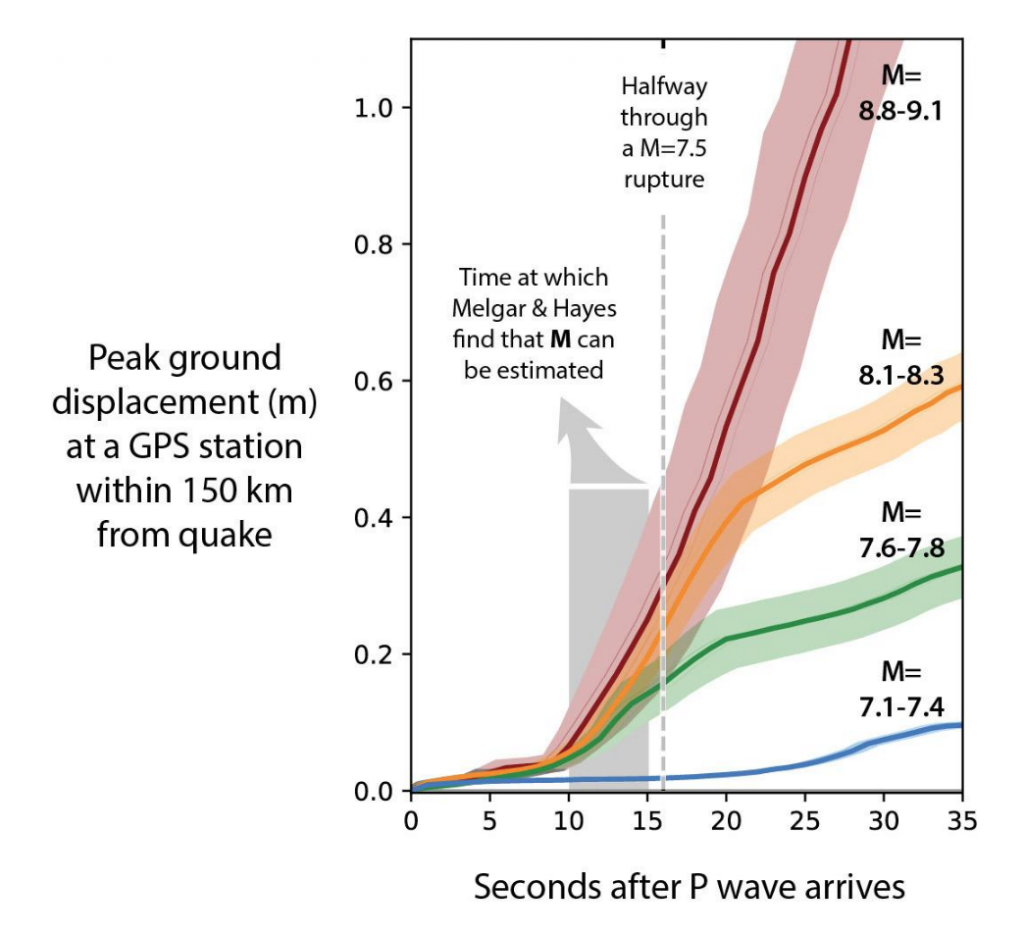
Melgar and Hayes’ supporting evidence, they say, lies in a technology similar to the GPS chip in every smartphone. High-resolution geodetic data (HR-GNSS) provides highly accurate motion information. In particular, the vertical movement near the source of very large earthquakes can be between 3 and 5 meters (about 10 to 15 feet), so Melgar and Hayes expected that the signal from near-source HR-GNSS data should be unmistakable. Sure enough, their analysis of the near-source GNSS data from twelve M≥7 earthquakes showed that for the first 10 seconds after the first indication of an earthquake was recorded, these earthquakes made small, almost immeasurable movements. But between 10 and 15 seconds, the amount of vertical displacement began to rapidly diverge for the different magnitude groupings. By 20 to 25 seconds, the vertical movement was distinct.
Skepticism remains
Men-Andrin Meier, a seismologist at Caltech who was not affiliated with this research, says he is concerned that Melgar and Hayes only have two quakes in the “largest magnitude bin, and three in the second-largest magnitude bin,” which is a limitation based on the rarity of large and very large earthquakes. It’s a significant weakness, he says, because “earthquakes have a very strong variability between different events, and so the probability of seeing such differences by mere chance is rather high.” This highlights another limitation of the HR-GNSS analysis: that when these large and very large earthquakes occurred in the past, there were not many HR-GNSS sensors close enough to detect the signal.
Previous research by Meier and others (2017) indicated that roughly half the source duration must pass before an accurate prediction could be made. In the context of the three-minute-long rupture propagation of the Tohoku earthquake, the implication is that 90 seconds must pass for the correct magnitude prediction, which would have been beneficial for the Japanese Earthquake Early Warning network. However, cutting the prediction time from 90 seconds to 15 seconds would be invaluable to earthquake early warning systems and tsunami prediction algorithms, where every second counts.
Consistency counts
The reality is, Melgar says, that given the rarity of magnitude-9 and greater earthquakes, it’s likely we won’t have those data for a few centuries yet. He stresses that it is the consistency between both the seismic and HR-GNSS analyses that reinforces the idea that 10 to 15 seconds after an earthquake begins may be sufficient for magnitude prediction. If Melgar and Hayes are right, then by the first 15 seconds of the March 2011 Tohoku earthquake, the earthquake knew it was going to be big, even though it ruptured for about 200 seconds.
The answer lies under the sea
Today, HR-GNSS sensors are installed onshore across the globe, but the majority of megathrust earthquakes occur underwater. To integrate Melgar and Hayes’ findings effectively into earthquake early warning systems would require sensors installed along the seafloor, they note. “You [would also] need to have fiber-optic cables from shore to the bottom of the ocean, winding around with sensors, and then eventually coming back on shore, and that’s not cheap,” Melgar says. Money is likely to be the biggest obstacle to implementation.
High risks, high rewards
An additional 10 to 30 seconds of warning to a city or nuclear reactor of an imminent quake would have enormous benefits. But if the hypothesis is wrong, using it now would lead to a greater rate of false alarms and missed quakes, eroding the value of these warnings to society. Melgar and Hayes acknowledge that their finding needs to be rigorously tested. Meier adds, “every new earthquake . . . puts predictions and theories to the test.” Both his, and theirs.
Check your risk with the Temblor App
References
Cryanoski, D., 2011, Japan faces up to failure of its earthquake preparations. Nature: 471, 556-557. doi:10.1038/471556a
Meier, M.-A., Ampuero, J.P., Heaton, T.H., 2017, The hidden simplicity of subduction megathrust earthquakes. Science: 357, 1277-1281. doi:10.1126/science.aan5643
Melgar, D. and Hayes, G.P., 2019, Characterizing large earthquakes before rupture is complete. Science Advances. 5, 1-7. doi: 10.1126/sciadv.aav2032
Additional Figure Cited in Comments/Replies
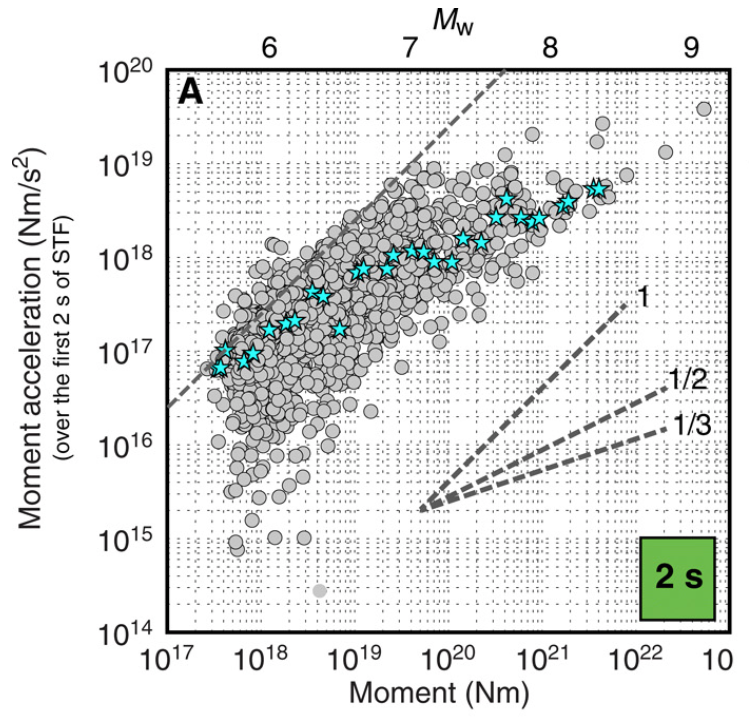 Fig. 2A from Melgar & Hayes (2019), that is referred to in the Comments/Replies below. The circles are the moment acceleration of earthquake source time functions (STF) at 2 seconds. Stars give median values for each 0.2 Mw bin. The light gray dashed line gives the theoretical limit to the data.
- Dual disaster planning, communication and reason for hope: a discussion with professor Sam Montano - April 14, 2020
- Significant Idaho earthquake unlikely to cause unrest in Yellowstone - March 31, 2020
- Earthquake strikes Utah amid COVID-19 pandemic - March 18, 2020