By David Jacobson and Ross Stein, Temblor
Tomorrow, a new study on the California earthquake hazard model will be published, which shows, through computer simulations, that in the week following a M=7.0 earthquake, the likelihood of another M=7.0 quake is up to 300 times greater than the week beforehand. This dramatic jump in likelihood is due to the inclusion of the short-term probabilities associated with aftershock sequences, a factor never before used in statewide comprehensive model like this one.
The California earthquake hazard model, the Uniform California Earthquake Rupture Forecast Version 3 (UCERF3), was first published in 2015, and quantifies the hazard posed by tectonic forces unleashed on faults. The 2015 model was the first to include the possibility that an earthquake on one fault could jump to another fault in a matter of seconds, thereby creating multi-fault ruptures. In doing so, over 250,000 rupture scenarios were created for the state of California, vastly more than in the previous model. The reality of such falling-domino or ‘cascading’ ruptures was demonstrated spectacularly in the 2002 M=7.9 Denali, Alaska, and the 2016 M=7.8 Kaikoura, New Zealand earthquakes.
It the study released tomorrow, dubiously dubbed ‘UCERF3-ETAS’ (ETAS refers to ‘epidemic-type aftershock sequence’ a concept borrowed from medical research and successfully applied to earthquakes by Yoshihito Ogata of Japan) takes it a step further by attempting to capture the role of aftershocks of all sizes following a mainshock. In a nutshell, for short times after a mainshocks, aftershocks matter.
Mainshocks, by changing the stress on surrounding faults, trigger aftershocks; if you like, the mainshocks are the ‘parents.’ But these aftershock ‘daughters’ can in turn trigger ‘grand-daughters’ aftershocks of their own, ad infinitum. While most aftershocks of any generation will be smaller than their mainshock, occasionally they will be the same size as their mainshock, and rarely they will be larger. This is contrary to the popular belief that for a M=7 quake, the largest aftershock will be less than M=6. By including this triggering potential and running hundreds of thousands of simulations, what you see as Dr. Field described it, are faults as “conduits of hazard” which appear like blood pumping through veins. It is important to point out that what we are seeing in these figures are not dynamically-triggered remote earthquakes, but rather the potential for one large earthquake to trigger another, and then perhaps another.
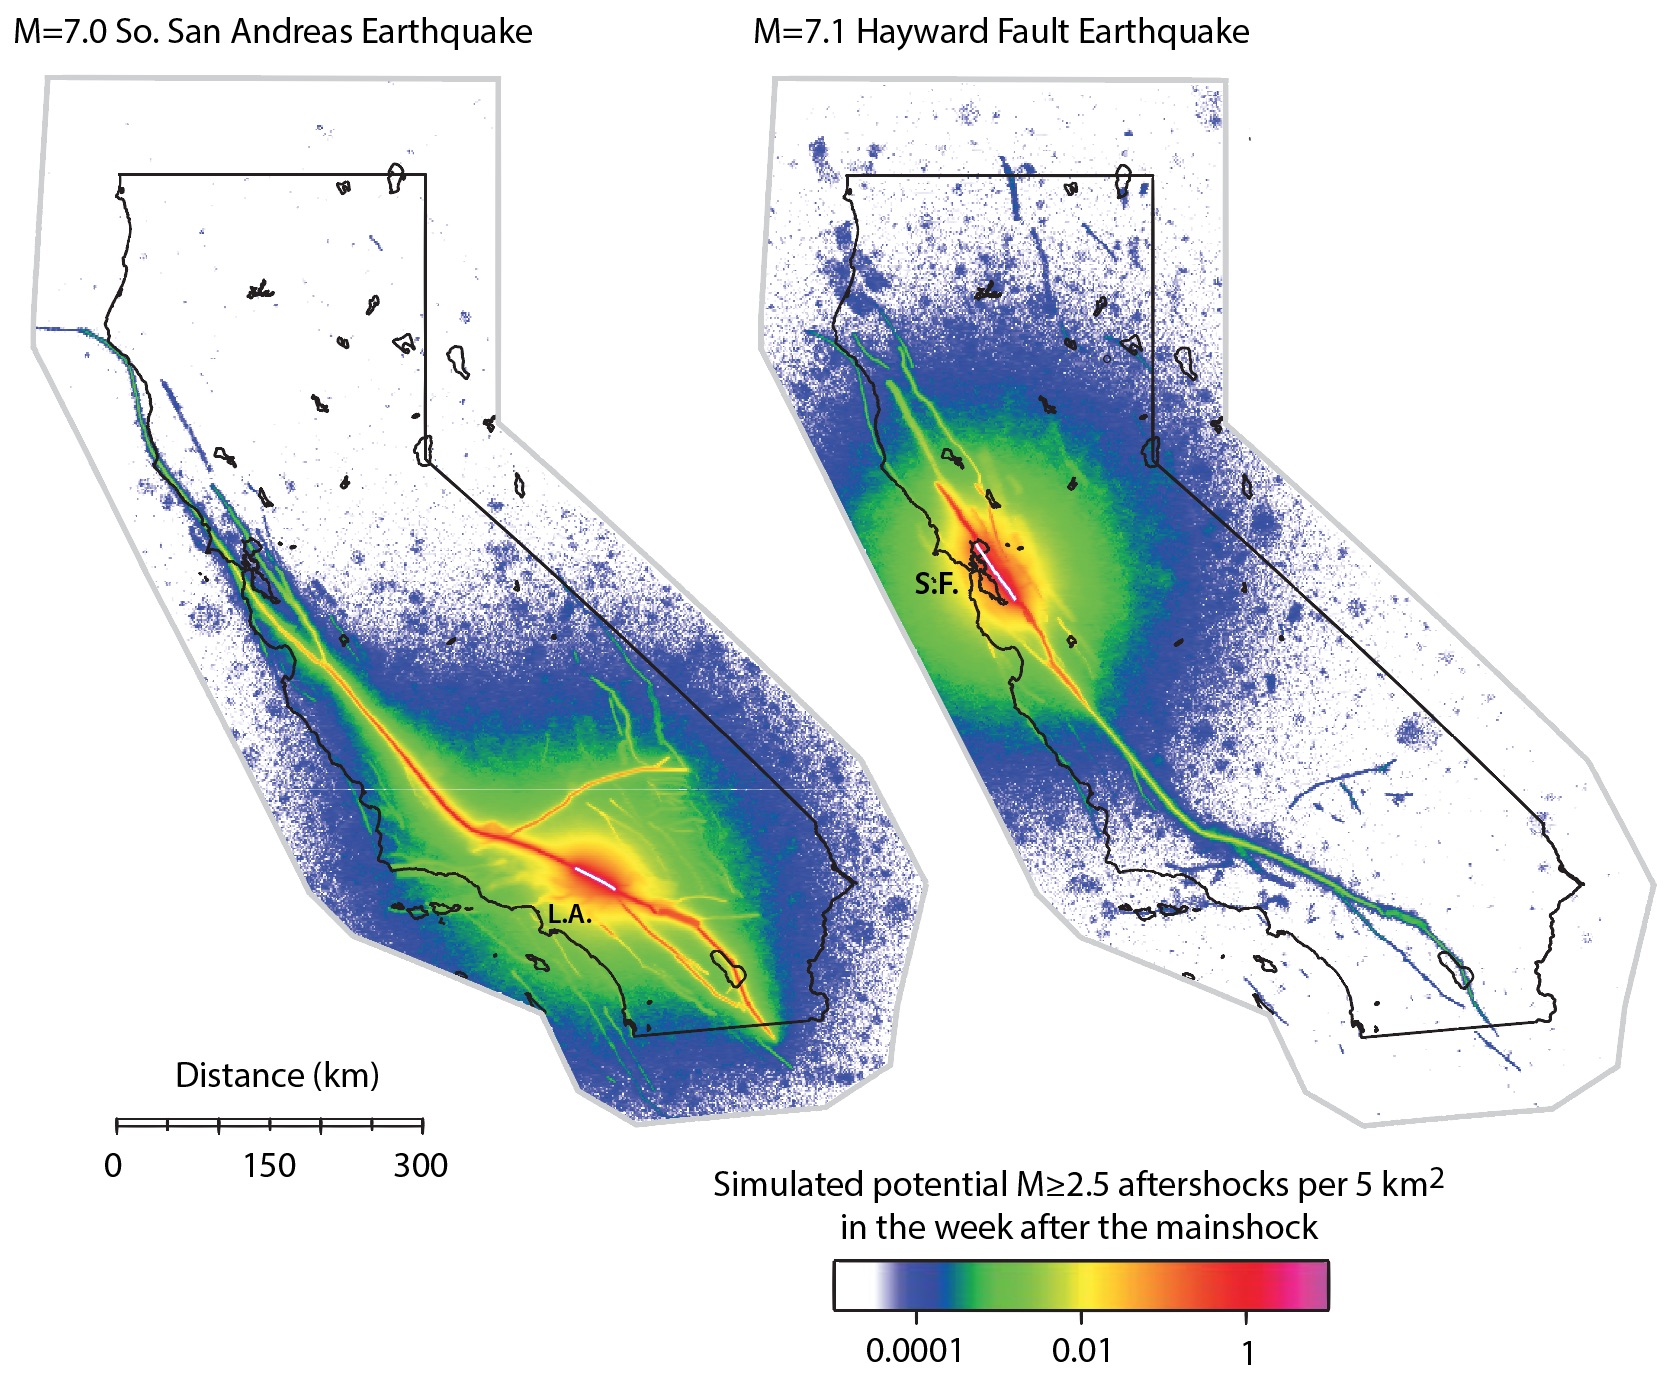
The study’s team had to choose an arbitrary time period for consideration. Because aftershocks rapidly decay in time, shorter the period, the greater the gain in triggering likelihood. They chose a week as being societally relevant. Nonetheless, the effects are also given for longer time periods such as a month and a year following a mainshock to illustrate the decayed effects over time. The figure above shows the simulated potential M=2.5+ aftershocks in the week after both a M=7.0 earthquake on the southern San Andreas, and a M=7.1 quake on the Hayward Fault running through the East Bay.
We consider their result an important advance, but there is still room for improvement. The figure below shows the simulated potential M=2.5+ aftershocks in the week after a M=6.1 earthquake along the Parkfield section of the San Andreas, shown in two ways. Such M~6.1 earthquakes have struck this portion of the San Andreas every 20-40 years, the most recent in 2004. The image on the right does not take faults into account, resulting in an idealized halo of simulated aftershocks. But it looks nothing like the actual Parkfield aftershock zones, or any other, which are never halos and often illuminate triggering lobes. Coulomb stress transfer gives this spatial pattern, and and so controls which faults are more likely, and which are less likely, to rupture next. That, in our judgement, is what is missing from this approach. While Dr. Field said in an interview that fault characteristics, such as magnitude-frequency distributions, are incorporated, it is still largely lacks Coulomb stress transfer, and that could come next.

The Field et al. study takes a great step forward in quantifying the short-term consequences of a large earthquake. In the week following a large magnitude earthquake the potential for a second large quake can increase 300 times; in the year after the mainshock, the gains are typically a factor of 10 according to Dr. Field.
The message is this: Unfortunately, after a large quake, it may not be over. Instead, there is a chance that the sequence has just begun, and could spawn daughters greater than their parents—as all children aim to be.
References
Edward H. Field, Thomas H. Jordan, Morgan T. Page, Kevin R. Milner, Bruce E. Shaw, Timothy E. Dawson, Glenn P. Biasi, Tom Parsons, Jeanne L. Hardebeck, Andrew J. Michael, Ray J. Weldon II, Peter M. Powers, Kaj M. Johnson, Yuehua Zeng, Karen R. Felzer, Nicholas van der Elst, Christopher Madden, Ramon Arrowsmith, Maximilian J. Werner, and Wayne R. Thatcher, A Synoptic View of the Third Uniform California Earthquake Rupture Forecast (UCERF3), Seismological Research Letters Volume 88, Number 5, doi: 10.1785/0220170045
Field, E. H., K. R. Milner, J. L. Hardebeck, M. T. Page, N. van der Elst, T. H. Jordan, A. J. Michael, B. E. Shaw, and M. J. Werner (2017). A spatiotemporal clustering model for the Third Uniform California Earthquake Rupture Forecast (UCERF3-ETAS): Toward an operational earthquake forecast, Bull. Seismol. Soc. Am. 107, doi: 10.1785/0120160173.
Personal correspondence with Dr. Edward (Ned) Field (USGS – Golden, Colorado)
- Earthquake science illuminates landslide behavior - June 13, 2025
- Destruction and Transformation: Lessons learned from the 2015 Gorkha, Nepal, earthquake - April 25, 2025
- Knock, knock, knocking on your door – the Julian earthquake in southern California issues reminder to be prepared - April 24, 2025