How a M=6 earthquake triggered a deadly M=7 in Japan

Ross Stein, Temblor and Shinji Toda, IRIDeS, Tohoku University, Japan


Citation:Stein R.S., Toda S., 2016, How a M=6 earthquake triggered a deadly M=7 in Japan, Temblor, http://doi.org/10.32858/temblor.009


熊本地震: M6地震がM7地震を誘発し,その後周辺の活断層にも影響が

Updated damage extent imagery

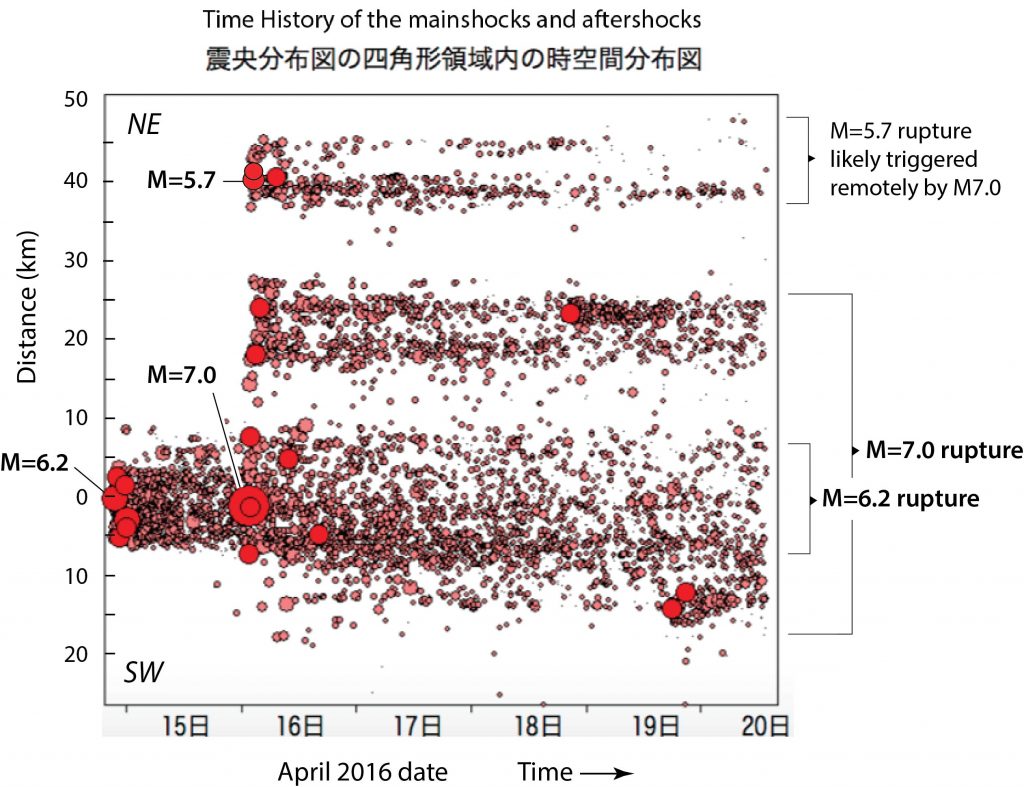
It’s been over four months since we wrote about the powerful Kumamoto quake sequence: The 15 April 2016 Mw=6.2 (Mjma 6.5) Kumamoto, Japan, shock, which was succeeded 28 hours later by the very damaging Mw=7.0 (Mjma 7.3) shock on the same fault system. We can now give you a preview of crucial new discoveries by Japanese and other researchers.

This photo redefines the meaning of ‘tuck-under parking.’ Soft first stories like this one are a menace the world over. They are often found in buildings with ground-floor parking or retail space, with spindly columns and inadequate shear bracing. Because most seismic motion is side-to-side, to resist collapse a building needs diagonal bracing or shear panels. Fortunately, no one died in this Kumamoto apartment building. But no one drove away, either. So, if you live or work in earthquake country in a building with tuck-under parking: Move.


This bridge is history. An earthquake-triggered landslide not only took out this highway overpass, but everything else in its path. This is why Temblor shows landslide susceptibility maps in its layer options. You don’t want to live on a slide—or just downslope from one either. There was also a zone of concentrated and extreme liquefaction at the base of the Mt. Aso volcano, in which several homes tilted or partially sunk.


Now you know why geologists love row planting: The right-lateral nature of the fault slip (whichever side you are on, the other slides to the right) could not be clearer. The fault rupture extends for about 30 km (20 mi) along the previously-identified Futagawa fault and northern Hinagu fault. Fault maps may not depict all active faults, but they tend to capture the ones on which M≥7 shocks can strike. The shaking is strongest along the fault, and any structure straddling the fault will be destroyed. Japan, the U.S, New Zealand, Turkey, Italy, and Greece have among the best fault maps in the world. The enormous effort this mapping takes clearly pays off.


The consequences of the earthquakes for the Japanese were significant, but they were also felt globally because of interconnected supply chains in the automotive industry. Many manufacturing plants shut down for several days to months, causing more than $20 billion in losses due to business interruption (‘BI’ in the timeline above). Reprinted from AIR Worldwide, with permission.


Here is the calculation made by Shinji Toda before the M=7 shock struck, indicating that the Hinagu Fault to the southwest, and the Futagawa Fault to the northwest, were brought closer to failure by the M=6.1 shock (now identified as M=6.2).  Parts of both faults subsequently ruptured.
Here is the calculation made by Shinji Toda before the M=7 shock struck, indicating that the Hinagu Fault to the southwest, and the Futagawa Fault to the northwest, were brought closer to failure by the M=6.1 shock (now identified as M=6.2). Parts of both faults subsequently ruptured.
The map on the left shows the seismicity after the Mw=6.2 (Mjma 6.5) mainshock until just before the Mw=7.1 (Mjma 7.3) mainshock. The future Mw=7.1 mainshock struck in an area of intensive aftershocks of the first mainshock. After the larger shock, the aftershock zone expanded to the southwest and to the northwest.


This time-distance plot of earthquakes shows that the Mw=6.2 aftershocks extended for about 10 km. Despite the calculated Coulomb stress increases to the NE and SW shown in the previous image, no remote aftershocks occurred beyond this 10-km-long zone until the Mw=7.1 struck a little over a day later. At that time, not only did the rupture extend another 30 km, but remote aftershocks appeared in the northeast near Oita, beyond the end of the rupture, possibly on the stressed Beppu-Haneyama Fault zone. You can also see those in the aftershock map. The disk size is proportional to earthquake magnitude.  Modified and interpreted from a JMA release on April 20.
This time-distance plot of earthquakes shows that the Mw=6.2 aftershocks extended for about 10 km. Despite the calculated Coulomb stress increases to the NE and SW shown in the previous image, no remote aftershocks occurred beyond this 10-km-long zone until the Mw=7.1 struck a little over a day later. At that time, not only did the rupture extend another 30 km, but remote aftershocks appeared in the northeast near Oita, beyond the end of the rupture, possibly on the stressed Beppu-Haneyama Fault zone. You can also see those in the aftershock map. The disk size is proportional to earthquake magnitude. Modified and interpreted from a JMA release on April 20.


Here is Shinji Toda’s calculation of the Coulomb stress imparted by the mainshock ruptures to the surrounding crust as a result of the combined M=6 and M=7 shocks. Regions in which strike-slip faults are brought closer to failure are red (the ‘trigger zones’); regions now inhibited from failure are blue (the ‘stress shadows’). Most of the aftershocks (the translucent green dots) lie in regions brought closer to failure, from which we infer that further strike-slip mainshocks are possible in the red lobes.


The Coulomb stress imparted by the mainshocks to the surrounding major active faults are calculated here. Very large stress increases are evident on the Hinagu and Unzen Faults southwest of the mainshocks, and more modest increases are resolved on the Beppu-Haneyama Fault zone to the northeast and Saga-heiya-hokuen Fault to the northwest. All four of these faults are associated with remote aftershocks of the Kumamoto mainshocks, indicating that the probability of large shocks on them has also increased. The city of Kumamoto is located just to the west of the “+4.2”.

What insights can we draw from the Kumamoto sequence?

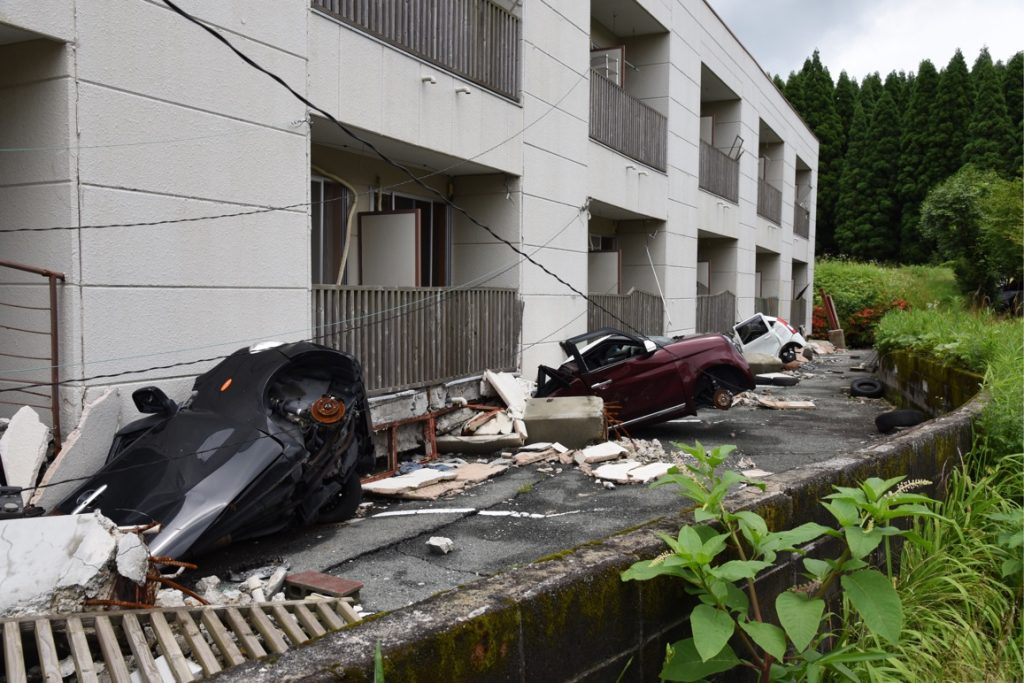
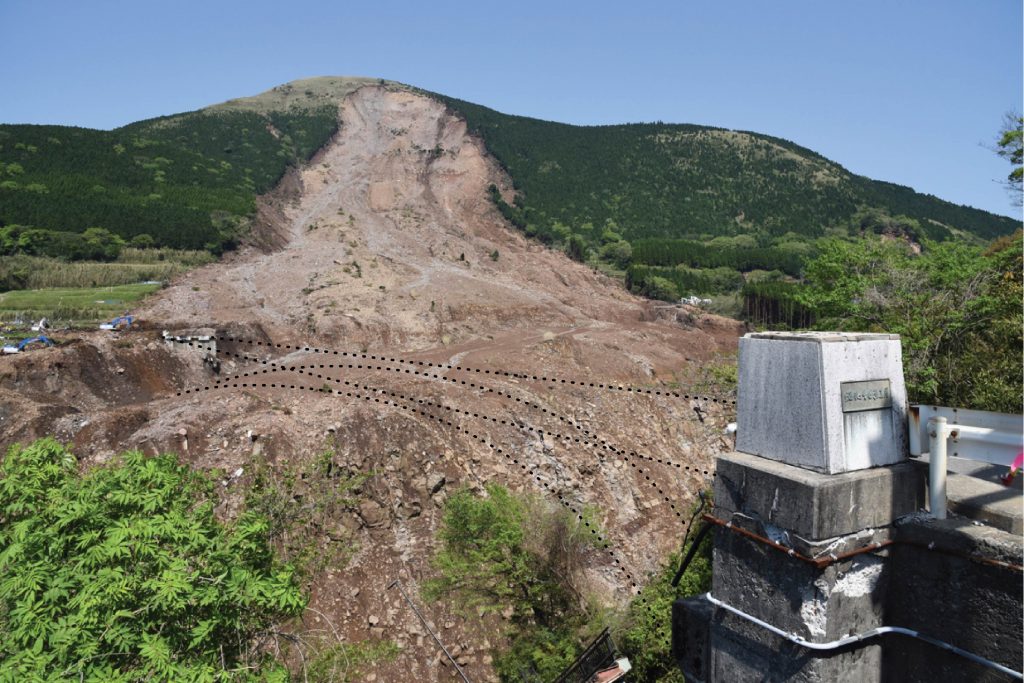
Even to a resilient country with a strong economy, one sees the enormous impact of an urban M=7 earthquake. Ground shaking, fault rupture, and landslides all took their toll, causing damage and disruption.

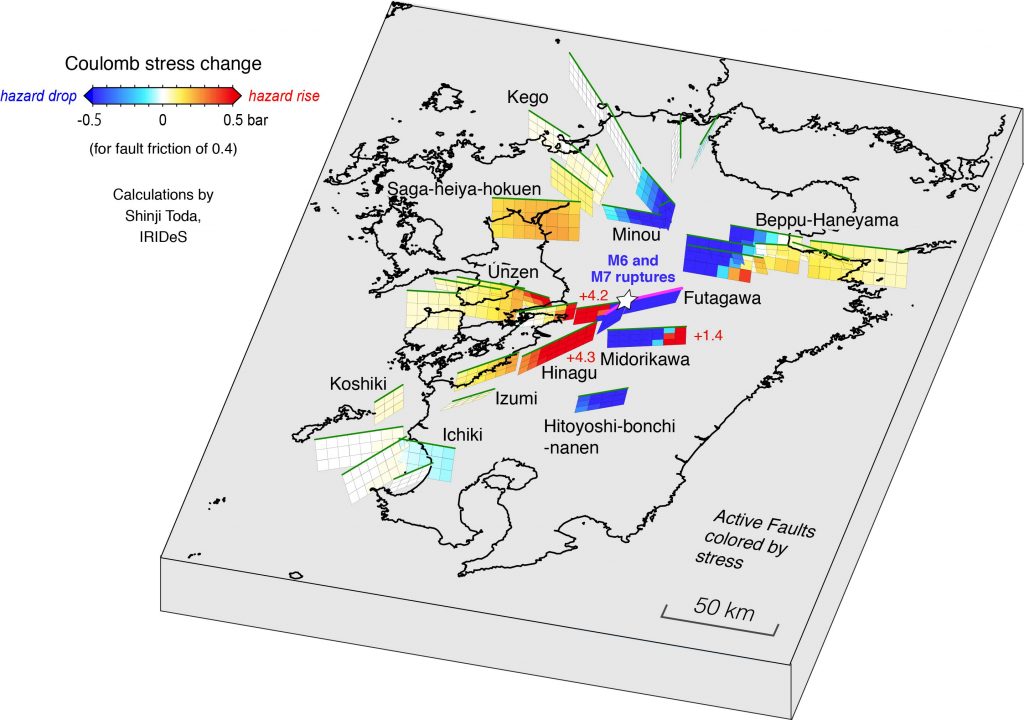
Scientifically, it is clear that Coulomb stress was imparted by the Mw=6.2 rupture to the site of the future Mw=7.1 mainshock, bringing the fault close to failure. The Mw=7.1 shock nucleated at the site of abundant aftershocks of the Mw=6.2 shock, aftershocks probably caused by that Coulomb stress increase. Together, the Coulomb calculation and seismicity observations provide a powerful tool to forecast future quakes. These forecasts will always be probabilistic; one will only be able to frame the findings in terms of chance. The chance that the M=6.2 would trigger a M=7.1 was small, but it was nevertheless much larger than before the Mw=6.2 struck. We believe that to advance seismic hazard assessment, these calculations must be carried out rapidly and systematically.

New in the Temblor web app: Global earthquake forecast

A few weeks ago we added the Global Earthquake Activity Rate (GEAR) model to the Temblor web app, which was published as Bird et al. (2015), and is called ‘Earthquake Forecast’ in the map layers menu. GEAR gives the likelihood of magnitudes 5-8 everywhere on earth; it is a blend of strain rate measured from GPS and the past 40 years of M≥5.8 quakes. The map contours the earthquake magnitude with a 1% per year chance of occurrence (which means about 60% chance of occurrence in a lifetime). In the map below, one can see that a M=7 shock at Kumamoto (blue pin) is expected about once a lifetime, whereas off Sendai, site of the 2011 M=9 shock, a M=8 has the same likelihood. Indeed, the M=9 Tohoku shock was quite rare, with the last similar event striking in AD 869. The Global Forecast will be added to the iPhone and Android App once we have received user feedback.

Japan-earthquake-forecast


Citation:Stein R.S., Toda S., 2016, How a M=6 earthquake triggered a deadly M=7 in Japan, Temblor, http://doi.org/10.32858/temblor.009


References:

IRIDeS (International Research Institute of Disaster Science)
JMA (Japan Meteorological Agency)
IEVG (Active Fault Research Group of the AIST Research Institute of Earthquake and Volcano Geology)
AIR Worldwide, http://www.air-worldwide.com/Publications/White-Papers/documents/Modeling-Supply-Chain-Disruptions-and-Contingent-Business-Interruption-Losses/
Bird, P., D. D. Jackson, Y. Y. Kagan, C. Kreemer, and R. S. Stein (2015), GEAR1: A Global Earthquake Activity Rate Model Constructed from Geodetic Strain Rates and Smoothed Seismicity, Bull. Seismol. Soc. Amer., 105, 2538–2554, doi: 10.1785/0120150058, http://geodesy.unr.edu/publications/bird_BSSA_2015.pdf