By Jessica O’Sullivan, Temblor
Check your seismic hazard rank

Cities are the perfect canvas for recording tectonic movement. There is evidence of the dynamic Earth all around us, and we don’t usually notice. It takes a keen and well-trained eye to spot the tiny signs of tectonic movement. But, for cities like Fremont and Hayward that rim the eastern shore of San Francisco Bay, rather than paving over geology, they reveal and record it.
The theory of plate tectonics states that the surface of the Earth is composed of large plate-like sheets of rock that slowly move around the globe. They crash together, forming mountains, and sink under one another, creating volcanoes. Additionally, in places, like the California Coast, they brush past each other in powerful earthquakes, creating large valleys, estuaries, and ridges.
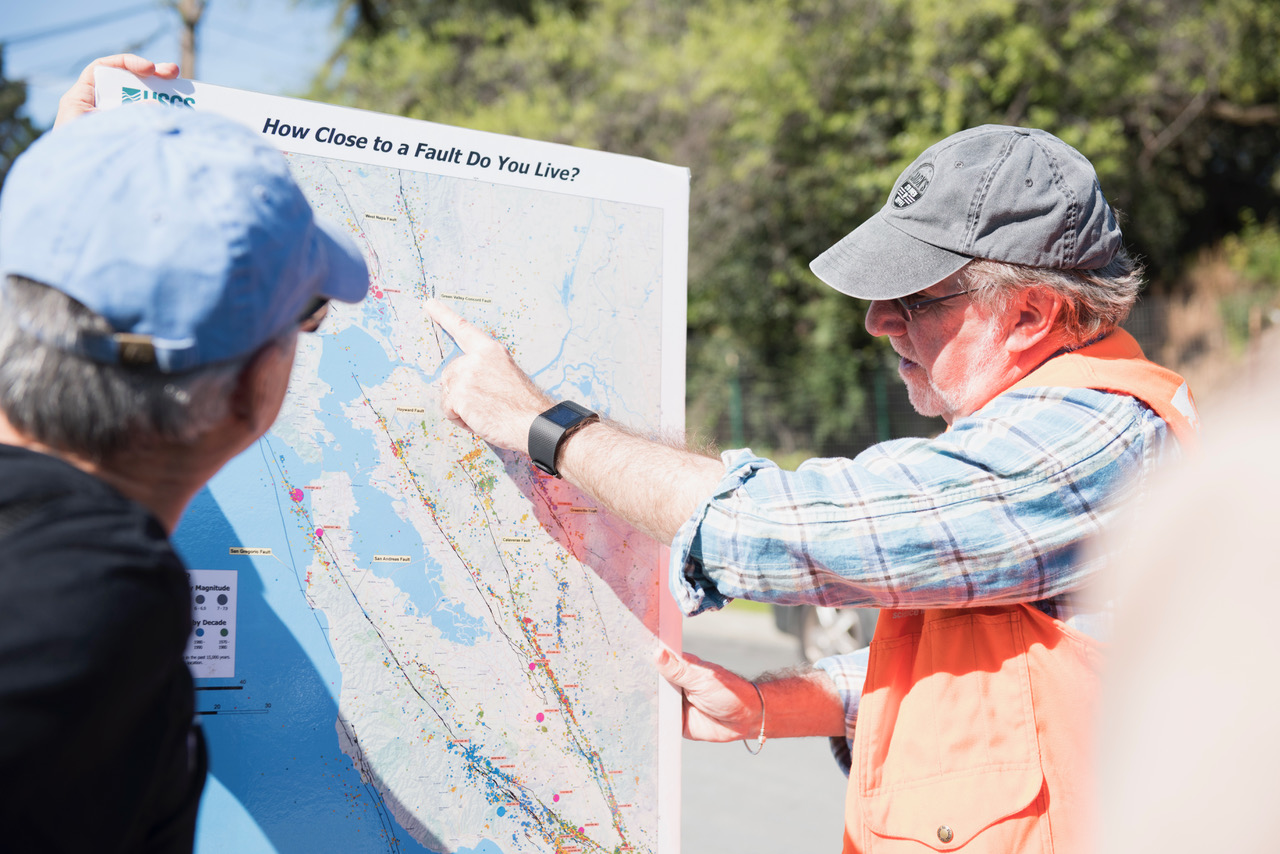
To find out what plate movement looks like in our own backyard, Team Temblor went romping through the Bay Area’s urban jungle with the USGS’ David Schwartz, one of the world’s leading paleoseismologists. Paleoseismology is the study of ancient earthquakes, and David has contributed to research around the globe: from the San Andreas in California, the Wasatch Fault in Utah, the Hebgen Lake Fault in Montana, the Denali Fault in Alaska, as well as faults in Peru, Mongolia and Italy. He also has the teaching skills to hint at what you should be looking for, and then ask you what you’ve found, rather than telling you what there is. So, he quickly transformed us into fault maniacs, following the clues in offset sidewalks, cracked asphalt and bulging buildings.
We spent our day tracing the Hayward Fault, which runs from San Pablo Bay in the north to San Jose in the south. The fault is part of the boundary between the North American continental plate and the Pacific oceanic plate. The movement is right-lateral, which means that whichever side of the fault you’re on, if you look across the fault, the opposing plate will be moving right. The San Andreas carries about half the plate motion (20 mm/yr) and the Hayward one-quarter (11 mm/yr). But, what makes the Hayward, Calaveras, and part of the San Andreas unique is that they not only produce quakes but also creep. This means you do not have to wait until the next great quake to see the impact of the fault.
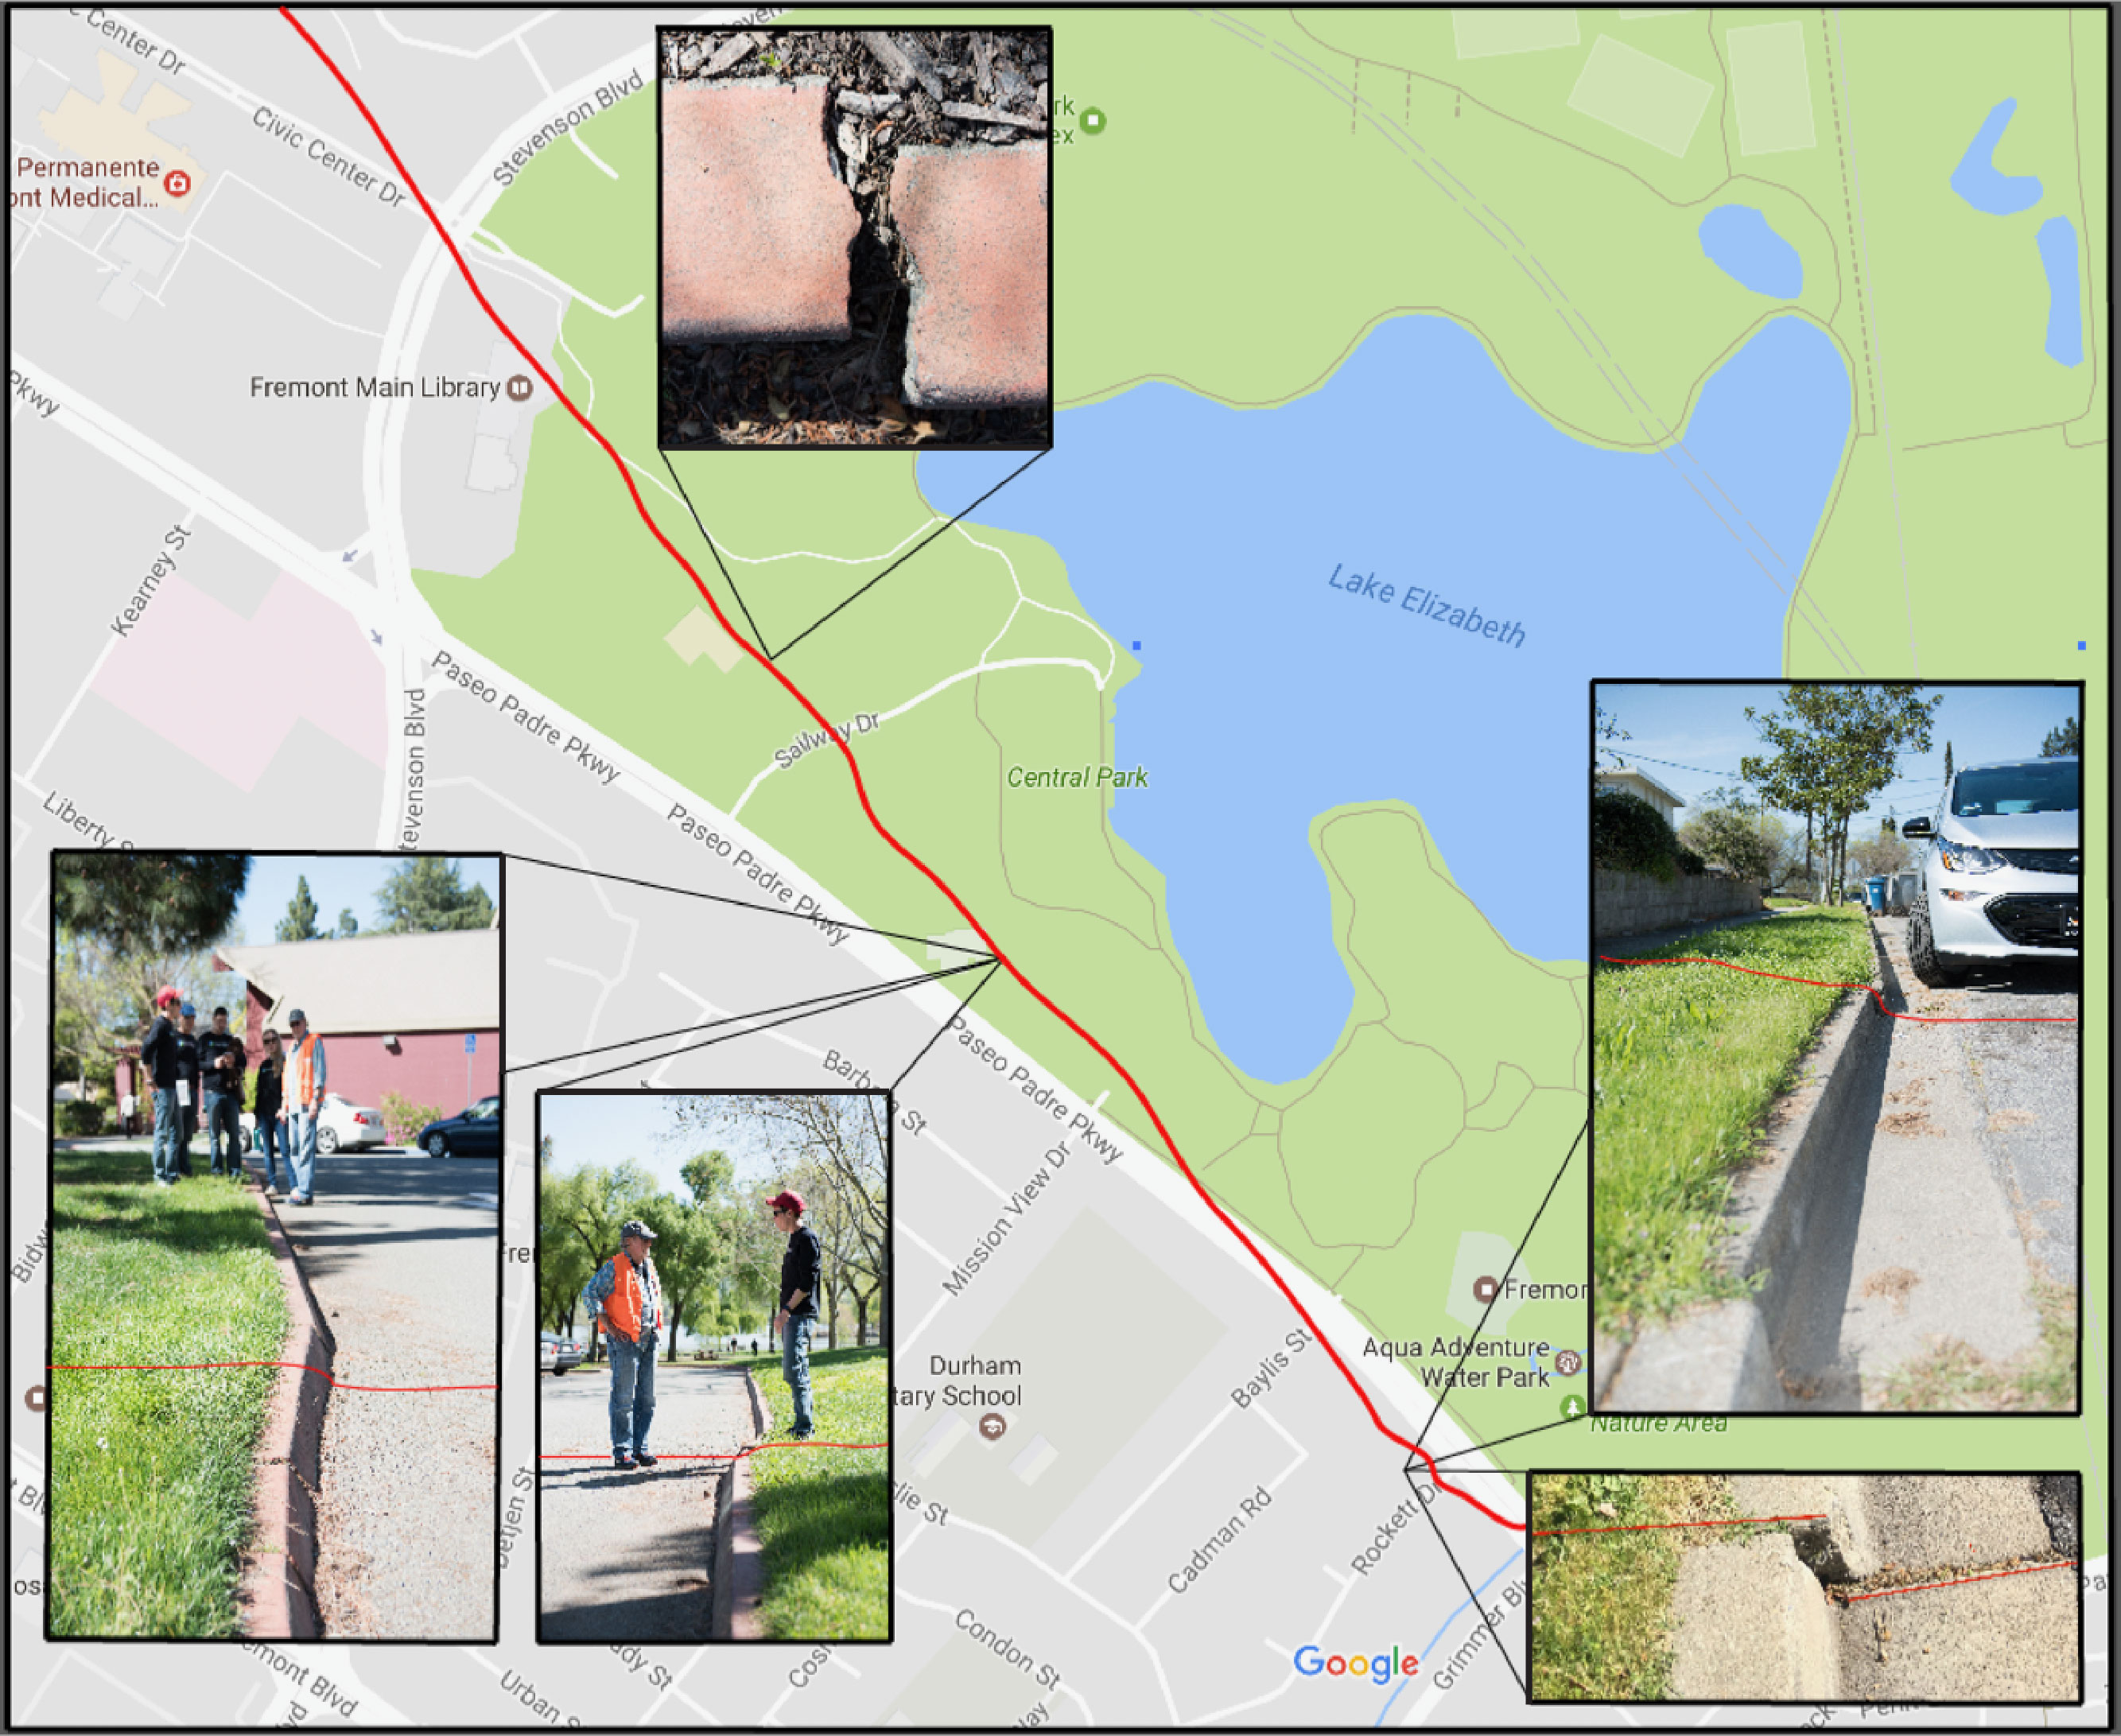
We began at an unassuming side-street in Fremont, California (Paseo Padre Parkway and Rockett Drive). A glance at the Temblor app showed we were at an address with a hazard rank of 95, meaning we were more at risk of a damaging earthquake than 95% of the US population. Here, we found the first set of features geologists use to find faults. As the Hayward Fault slowly moves, the on either side of the fault gets displaced. At this specific location, curbs were misaligned by a few centimeters. We traced the fault beneath an apartment building (yikes!), and could see that its garage and front steps were distorted.
Rather than occurring in earthquakes, these misalignments are the result of creep, which is steady or episodic movement along a fault. When a fault isn’t creeping, it is referred to as locked. Even though creeping faults don’t build up shear stress as easily as locked faults do, it does not mean an earthquake won’t occur. The Hayward fault has both creeping AND locked sections, and some patches appear capable of both. According to Schwartz, the part of the fault we were standing on is moving at a rate of 5 mm/yr. It’s not a lot, but enough to cause visible movement in sidewalks and curbs.
In addition to bending curbs, large cracks in the asphalt are another indicator of slow creep. The cracks, which often step outward and are referred to as en echelon are the result of the pavement shearing and stretching (See picture below).

While evidence of creep is visible in sidewalks and curbs, the Hayward Fault’s movement in earthquake is evident in the topography. In the figure below, which has LiDAR (radar) imagery overlain, a stream channel with two right-lateral offsets is labeled. The total offset at this location is approximately 85 m (278 ft) which accounts for about 7,700 years of movement.

Can you find similar signs in your neighborhood? Check where your local fault is on the Temblor app and send us photos of your local faulting! Photos will be featured on our Instagram (@temblor_app).

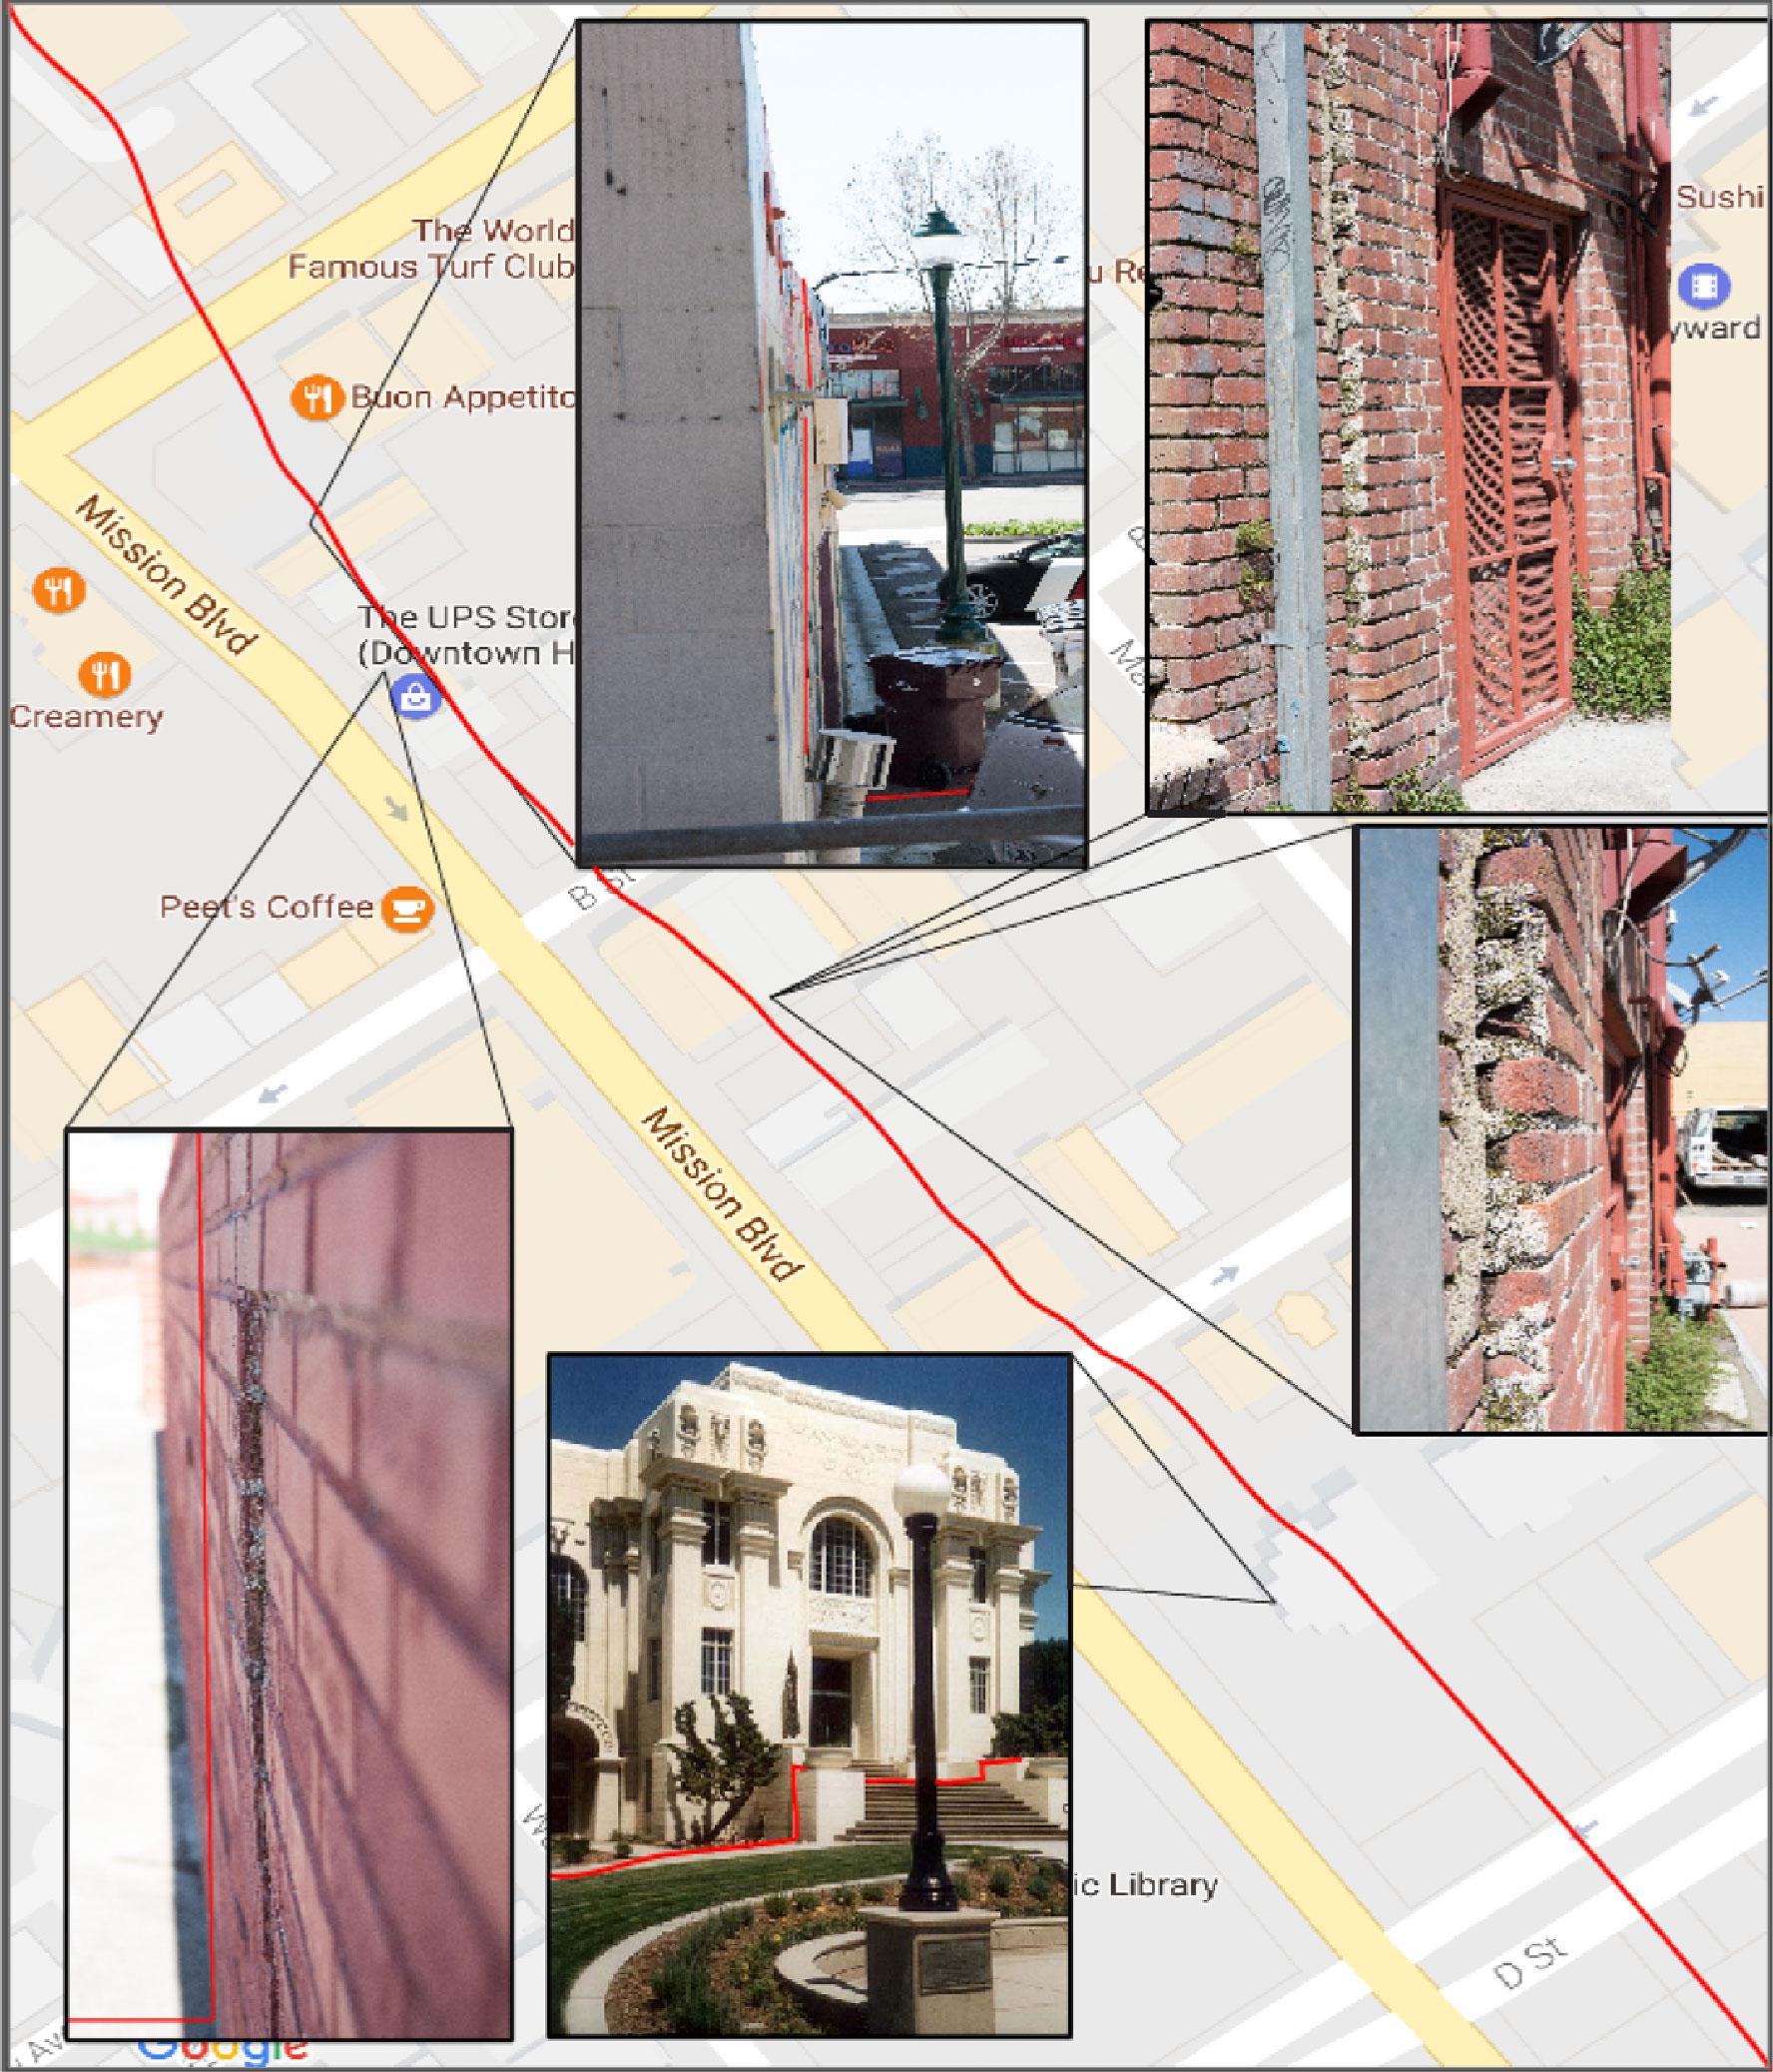
The maps below show locations along the fault which have been offset by the slow creep of the Hayward Fault
- Earthquake science illuminates landslide behavior - June 13, 2025
- Destruction and Transformation: Lessons learned from the 2015 Gorkha, Nepal, earthquake - April 25, 2025
- Knock, knock, knocking on your door – the Julian earthquake in southern California issues reminder to be prepared - April 24, 2025