


Jason R. Patton, Ph.D., Ross Stein, Ph.D., Volkan Sevilgen, M.Sc.
Here are the three most important insights gleaned from last week’s earthquake. (Our initial article on this Alaska earthquake can be found here.)
Building Codes Work
- Anchorage was destroyed in the 1964 M=9.2 Good Friday quake, and rebuilt in the mid-1960s to high code standards. So, buildings performed well. Good buildings will also perform well in the Bay area, which Temblor accounts for in its damage estimates.
In late March of 1964, there was a magnitude M=9.2 earthquake in Alaska now called the Good Friday earthquake. Secondary effects included strong ground shaking, damaged buildings and infrastructure like roads, rapid uplift and subsidence across broad regions, landslides, and a tsunami that traveled across the Pacific Ocean.
This earthquake had a major impact upon the debate about plate tectonics. Watch this excellent and entertaining video to learn about how this Good Friday Earthquake fit into the story of plate tectonics.
Over 100 people perished from the earthquake and the secondary effects in 1964. The majority of the earthquake damage was located in the Anchorage area.
Following the earthquake, the efforts to rebuild Anchorage resulted in improved building codes that regulated the construction of buildings designed to withstand the forces felt during an earthquake like the Good Friday earthquake.
The 2018 M=7 earthquake generated ground shaking strong enough to damage buildings. However, because the buildings built in Alaska were designed with these improved building codes in mind, the buildings performed rather well during this later M=7 earthquake.
Elsewhere in earthquake country, like in California, Washington, and Utah, buildings are also constructed with these seismic hazards in mind. Thankfully, the modern buildings built in these regions should also behave well during earthquakes. However, there is much room for improvement for buildings built prior to about 1975, when major changes occurred in the building code, and again in about 1995. If you live in these areas and your home or building is older, your building may need a seismic retrofit. Visit this page to locate an expert or licensed professional who can help you make the best choice for your needs.
The closer you are the stronger you are shaken
- The Anchorage M=7 quake struck 44 km (26 miles) deep, and the top of the fault lies 32 km (20 miles) below the surface. In contrast, in the Bay area, Los Angeles, Salt Lake City, and for some Seattle events, large quakes will extend from a depth of only about 12 km (8 miles) all the way to the ground surface, and so will be roughly four times more destructive for the same size. Temblor uses these shallower depths in our damage estimates.
Let’s say we live in San Francisco or in Seattle. On 30 November 2018, did we feel the Alaska M=7 earthquake? Why not? That’s right, because we were too far away. The closer to the source earthquake, the stronger the ground shaking and the greater the intensity.
Do you know what your exposure is to earthquake hazards, what your potential risk from seismic hazards? To learn more about your exposure to these hazards, visit temblor.net.
Below is a map prepared using the temblor.net app. Seismicity from the past month, week, and day are shown as colored circles. The rainbow color scale represents the chance of a given earthquake magnitude, for a given location, within the lifetime of a person (technically, it is the magnitude with a 1% chance per year of occurring within 100 km).
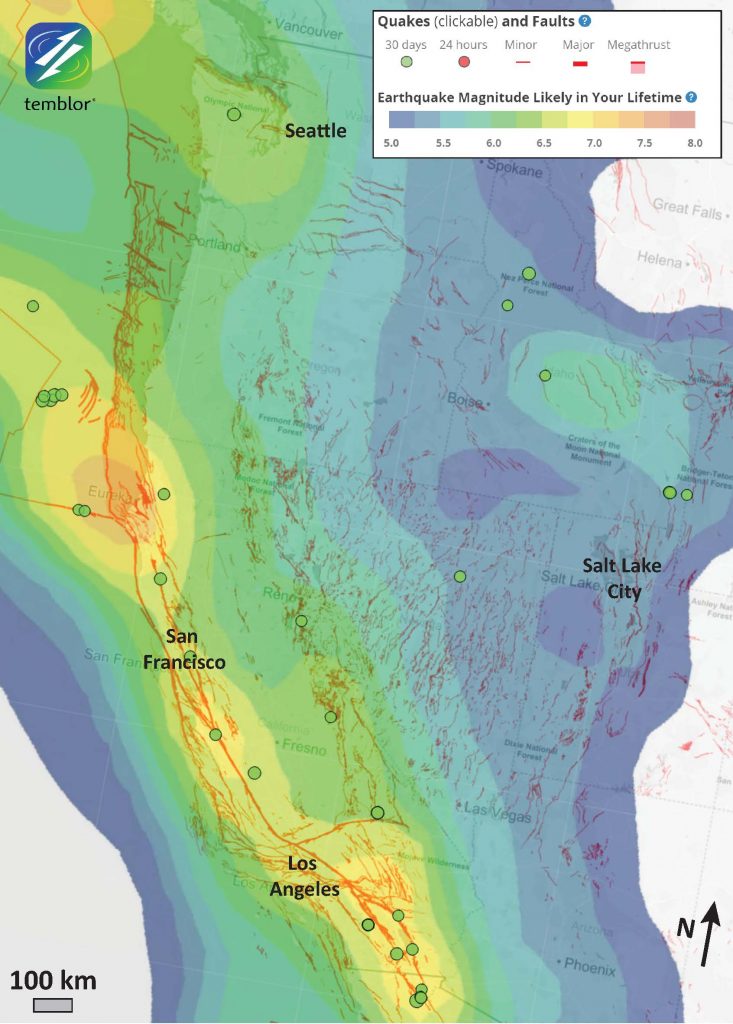

Global Earthquake Activity Rate (Bird et al., 2015) map for this region of the western United States. Faults are shown as red lines. Warmer colors represent regions that are more likely to experience a larger earthquake than the regions with cooler colors. Seismicity from the past month are shown.
Liquefaction is a menace
- Most of the Anchorage damage was to roads and pipelines in liquefaction zones. The Bay area, the Southland, Seattle, and Salt Lake City also have highly liquefiable soils, which we account for in our calculations. Infrastructure damage will interfere with water, power, cell and internet access and commutes after a large quake.
After the dust settled, the observations of damage led to some rapid repairing of roads and other important infrastructure. Upon first glance, the majority of damage from the M=7 Anchorage earthquake was to roads and pipelines in liquefaction zones. More about liquefaction and how this process can lead to damage can be found in our earlier article here.
Vast areas of land in the Bay area, the Southland, Seattle, and Salt Lake City have liquefiable soils. Damage to essential infrastructure in these soils could have economically catastrophic impact to the economies of any of these municipalities. The potential for a location to experience liquefaction is also included in the Temblor Earthquake Score.


References
Bird, P., Jackson, D. D., Kagan, Y. Y., Kreemer, C., and Stein, R. S., 2015. GEAR1: A global earthquake activity rate model constructed from geodetic strain rates and smoothed seismicity, Bull. Seismol. Soc. Am., v. 105, no. 5, p. 2538–2554, DOI: 10.1785/0120150058
Archbold, J., Hassan, W.M., Kijewski-Correa, T., Marshall, J., Mavroeidis, G.P., Mosalam, K.M., Muin, S., Mulchandani, H., Peng, H., and Pretel, R., 2018. Alaska Earthquake Preliminary Virtual Assessment Team (P-VAT) Joint Report, Structural Extreme Event Reconnaissance Network StEER: Structural Extreme Event Reconnaissance Network& Earthquake Engineering Research Institute (EERI), 80 pp.