
Experts dive into what went well and what needs to be improved when it comes to major earthquakes in Istanbul, Türkiye.
By M. Erdik, Boğaziçi University, Istanbul, Türkiye, A. Pınar, Turkish Earthquake Foundation, Istanbul, Turkey, Ö. Kale, Department of Civil Engineering, TED University, Ankara, Türkiye, E. Altunel, Eskişehir Osmangazi University, Engineering Faculty, Department of Geology, Eskişehir, Turkey, M. B. D. Tümsa, Turkish Earthquake Foundation, Istanbul, Turkey, N.M. Apaydın, Kandilli Observatory and Earthquake Research Institute, İstanbul, Turkey, M. Çomoglu, Geoscience Australia, M. A. Sandıkkaya, Department of Civil Engineering, Hacettepe University, Ankara, Türkiye, and B. Güryuva, Department of Engineering Sciences, Middle East Technical University, Ankara, Türkiye
Citation: Erdik, M., Pinar, A., Kale, Ö., Altunel, E., Tümsa, M. B. D., Apaydın, N. M., Çomoğlu, M., Sandıkkaya, M. A., and Güryuva, B., 2025, April 2025 magnitude 6.2 earthquake near Istanbul highlights strengths and weaknesses in seismic mitigation, Temblor, http://doi.org/10.32858/temblor.368
On April 23, 2025, at 12:49 p.m. local time, a magnitude 6.2 earthquake struck the Kumburgaz segment of the northern branch of the North Anatolian Fault Zone in the Marmara Sea, a small inland sea that’s entirely within the borders of Turkey. The earthquake struck about 5 kilometers south of the 2019 magnitude 5.7 tremor. As of April 24, more than 100 aftershocks followed the mainshock. The quake was the strongest to hit the region since the 1999 magnitude 7.4 Izmit (Kocaeli) earthquake.
The northern branch of the North Anatolian Fault Zone has a long history of seismic activity, with major earthquakes occurring in the 10th, 14th, 16th, 18th, and 19th centuries. Damage associated with these earthquakes is well recorded in Istanbul’s historical structures.
The latest earthquake, felt across southeastern Europe and western Anatolia, caused only light damage. The incident also disrupted National Sovereignty and Children’s Day celebrations. Due to panic-induced incidents, hundreds of people were injured. For example, some people jumped from buildings out of fear that the building may collapse, or they fell while running from indoors to outside.
The earthquake was well-recorded by about 200 seismometers located in the Marmara region and about 1,500 strong motion sensors located on the ground or installed on structures. The Earthquake Rapid Response Network of the Kandilli Observatory and Earthquake Research Institute and the Earthquake Protection System of the İGDAŞ Natural Gas Distribution System functioned as designed; that is, it provided real-time shaking-level distribution for the automatic shut down of gas within the city gas network (if acceleration thresholds were exceeded) during the emergency.
The earthquake reignited concerns about Istanbul’s preparedness for major seismic events. Experts warn that the North Anatolian Fault, which stretches across northern Turkey and partially runs beneath the Sea of Marmara, is due for a potentially larger earthquake (exceeding magnitude 7.0) with an annual probability of about 2% to 3%. This paper is intended to provide timely information on several topics: the physics of the earthquake; the seismicity of the region; earthquake hazard and risk; and observations of strong ground motion and associated losses from shaking.
Details of April 23 mainshock, foreshocks and aftershocks
Earthquake Characteristics
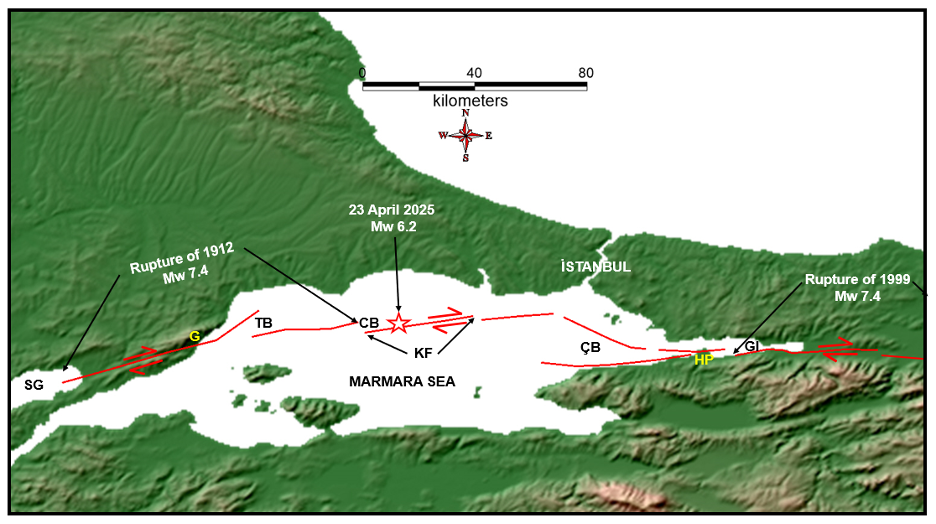
The April 23, 2025, magnitude 6.2 Marmara Sea earthquake occurred on the northern branch of the North Anatolian Fault Zone — a section of the fault that crosses the Marmara Sea, also known as the Main Marmara Fault. From east to west, the northern branch enters the Marmara Sea in Izmit Bay (Figure 1), extending along the southern side of the Bay up to the eastern side of the Hersek Peninsula — the fault’s last location on land for several hundred kilometers.
The fault reenters the Marmara Sea west of the Hersek Peninsula and extends to Ganos, where the surface trace of the North Anatolian Fault Zone is again exposed on land. In the Marmara Sea, between the Hersek Peninsula and Ganos, the fault exhibits a right-stepping pattern, resulting in pull-apart basins such as the Tekirdağ, Central, and Çınarcık basins (Figure 1). The slip rate on the northern branch of the North Anatolian Fault Zone is 13.6 ± 1 millimeter per year (Kozacı and Altunel, 2022).
Foreshocks and Aftershocks
Kandilli Observatory and Earthquake Research Institute (KOERI) operates more than 200 strong- and weak-motion stations in the Marmara region. Such a dense seismic network is capable of precisely constraining the hypocentral depths of the aftershocks of the April 2025 event. The aftershock distribution in Figure 2 illustrates that most of the activity concentrates east of the mainshock location (the mainshock is shown as the largest circle and is further denoted by its focal mechanism, or beachball diagram). The aftershocks are localized around the main fault trace of the North Anatolian Fault, indicated by the solid white line. The total length of the aftershock distribution is about 20 kilometers.
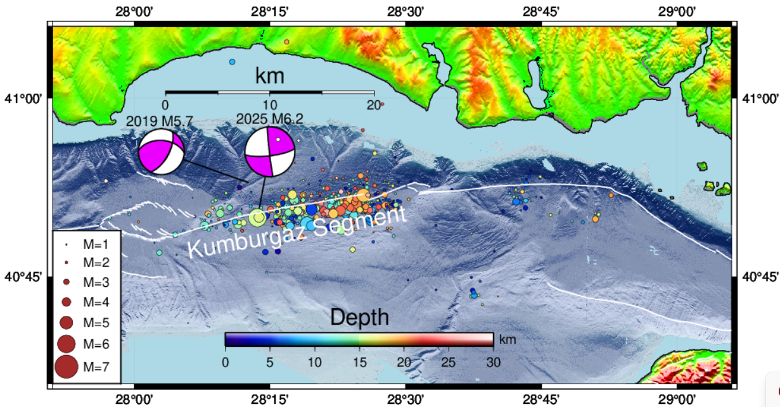
However, aftershocks are not uniformly distributed along the ruptured fault plane. The 10-kilometer-long western section of the ruptured plane accommodates only a few aftershocks, whereas the 10-kilometer-long eastern section of the ruptured plane hosts most of the aftershocks. What could be the implications of such an aftershock pattern?
Because the hypocenter is located on the western section of the ruptured plane, one can conclude that the major moment release (which is akin to an energy release) occurred there, resulting in a significant stress drop. Therefore, this part of the fault requires no or few aftershocks for stress redistribution.
The high density of aftershocks in the eastern section relative to the western location of the mainshock may suggest eastward rupture propagation, where the slip amount is relatively small. Higher aftershock activity could, therefore, compensate for heterogenous slip on the ruptured fault plane. A slip distribution model for the mainshock is presented in the next sections.
About 36 minutes prior to the April 23 mainshock, a foreshock occurred at a depth of 16 kilometers (Figure 3). The mainshock struck just above, at a depth of about 15 kilometers.
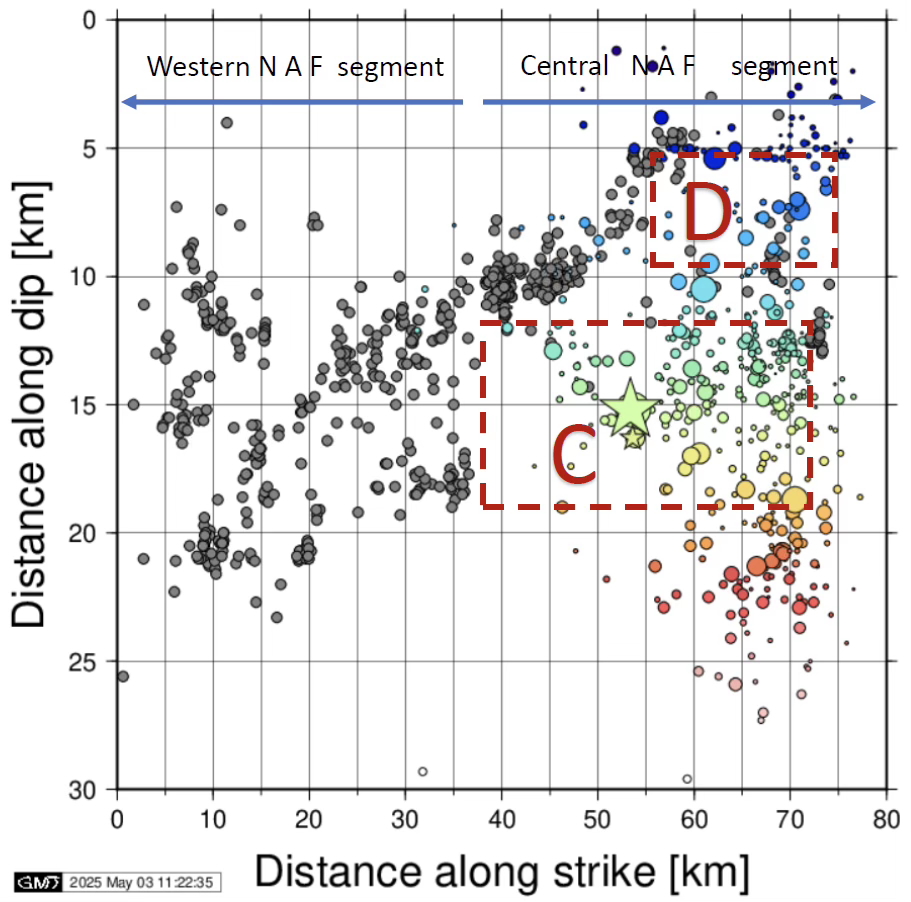
This initiating mechanism is similar to that of the 1999 Izmit earthquake’s rupture. For the 1999 earthquake, foreshocks were observed in the lower crust (see Bouchon et al., 2011). Therefore, the depth distribution of the aftershocks of the 2025 event should be considered — particularly those in the 20 to 25 kilometer range, an unusual depth for brittle failure of rocks.
We believe that the aftershock depth determinations for the 2025 event are reliable because this region is densely instrumented; KOERI operates a high-density seismic network in the Marmara region. Additionally, Yamamoto et al. (2020; 2022) present data from a 15-station ocean bottom seismometer network deployed near the main fault trace of the North Anatolian Fault that supports earthquakes occurring between 20 to 25 kilometers depth (Figure 3).
Interestingly, most of the aftershocks of the April 2025 mainshock are located at a depth range of 10 to 20 kilometers, which may point to asperities marked by Yamamoto et al. (2017; 2020). We can conceptualize an asperity on a fault plane as an imperfection on an otherwise flat surface; an asperity is where the fault gets stuck. Figure 9 of Yamamoto et al. (2020) shows an asperity where almost no seismicity is observed, implying that the fault plane is locked. It seems that the April 23 earthquake ruptured the asperities “C” and “D” marked by Yamamoto et al. (2017; 2020), which are shown in Figure 3.
Fault Plane Solution
The fault plane solution of the mainshock determined by U. S. Geological Survey (USGS) is given in Figure 4 (beachball on the left). The faulting parameters of the east-west striking nodal plane (strike 83 degrees, dip 77 degrees, and rake 178 degrees) match the geometry of the North Anatolian fault trace in that region. Using these faulting parameters and the teleseismic body waveforms from the NSF SAGE data archive operated by EarthScope Consortium, we calculate a slip distribution model (Figure 4).
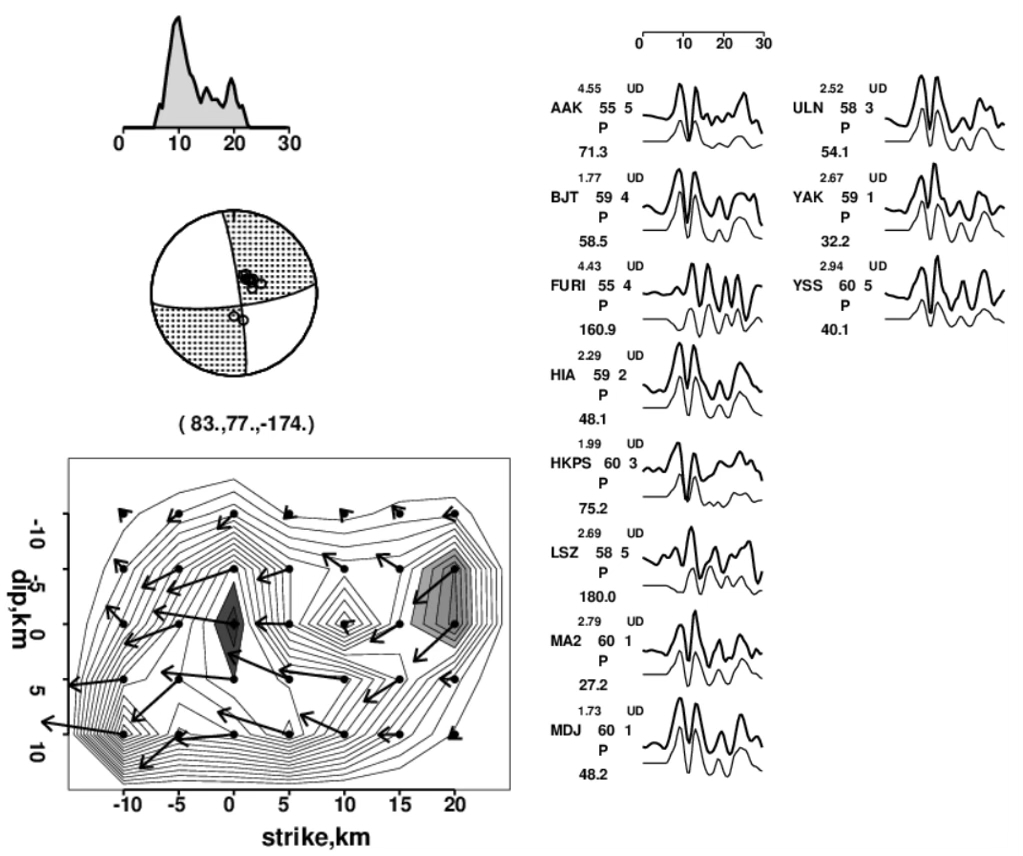
The moment rate function — a calculation that quantifies how the seismic moment (energy) was released during rupture — points to a rise time of about 3 seconds and a rupture time of about 10 seconds (upper left section of Figure 4). Such a moment rate function suggests a lower-than-normal rupture velocity, considering that the ruptured fault length is about 20 kilometers. In other words, the fault ruptured more slowly than expected. And so, such low rupture velocities may explain the lower-than-expected (for an event of this size) acceleration values that we observed.
The lower left section of Figure 4 shows our calculated slip distribution model, which graphically demonstrates how slip was distributed on the fault plane. The size of the arrows is proportional to the slip amount derived for each grid cell of 5 kilometers by 5 kilometers. We see that the slip values in the western section are higher than the ones in the eastern section.
For the inversion of the teleseismic data, which involves using the slip distribution model to calculate waveforms at various locations and comparing those calculations with observations from seismic stations, we used a grid of 30 kilometers along the strike and 20 kilometers along the dip at a 5 kilometer spacing (right-hand column of Figure 4). The upper traces are the observed seismograms, and the lower traces are the calculated ones. Note the satisfactory fits despite the complexity of the waveforms. The dots within the beach ball in the central-left part of the figure denote the station locations with respect to the fault plane. Stations to the north and to the south of the fault plane are included in the inversion, implying reliable constraints on the solution.
Past Seismicity
Historical Seismicity
In the Marmara region, the North Anatolian Fault Zone bifurcates into two branches — a northern branch, called the Main Marmara Fault, and the southern branch. The April event ruptured an approximately 15-kilometer-long section along the northern branch that crosses the Sea of Marmara. The segmentation of the northern branch results in faults with different seismicity and geometry (Yamamoto et al., 2020; 2022).
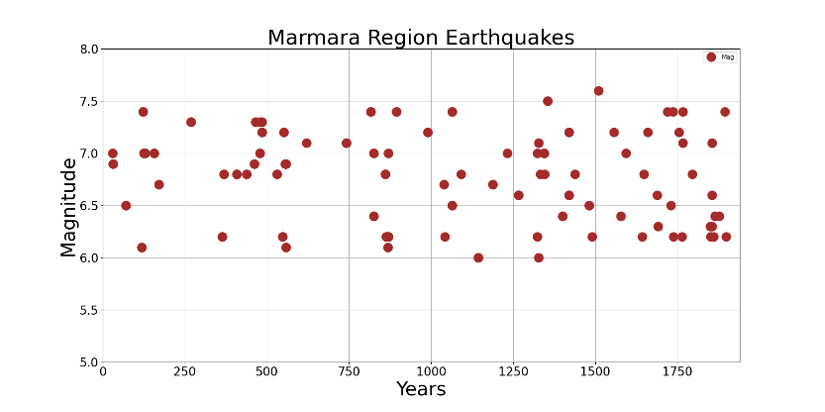
Owing to the large number of old settlement locations in the Marmara region, historical seismicity is rich and well-documented. This history includes earthquakes that have occurred over the last 2,000 years (e.g., Ambraseys, 2002; Bohnhoff et al., 2016; Murru et al., 2016) as shown in Figure 5. Such an even temporal distribution of historical earthquakes greater than magnitude 6 suggests that the area is prone to frequent moderate-size earthquakes. As such, it is noteworthy that, over the last 90 years, four moderate-sized earthquakes have already taken place in the Sea of Marmara.
Several studies are available that have compiled detailed earthquake catalogs (e.g., EMEC, EMME, SHEEC, SHEEC-CET, EPICA) covering the historical and instrumental period of seismicity in the Marmara region (Grünthal and Wahlström 2012; Stucci et al., 2013; Rovida et al., 2022). The last large event that ruptured the fault segment accommodating the recent magnitude 6.2 event was the May 22, 1766 earthquake, which likely had a magnitude greater than 7.0 (Pondard et al., 2007; Meghraoui et al., 2012; Murru et al., 2016; Parsons, 2004; Rovida et al., 2022). Thus, the fault segment that hosted the recent earthquake is capable of generating larger ones.
Instrumental Seismicity
Surface-rupturing events of the instrumental period include the 1912 magnitude 7.4 Mürefte-Şarköy and 1999 magnitude 7.4 Izmit earthquakes in the west and east sectors of the Marmara Sea, respectively. The surface rupture of the 1912 magnitude 7.4 earthquake extends between the Gulf of Saroz in the west and the Marmara Sea in the east. However, the eastern termination of the rupture in the Marmara Sea is under debate. Although some researchers (e.g., McHugh et al., 2006) propose that the rupture terminates in the Tekirdağ Basin, others (e.g., Altunel et al., 2004; Armijo et al., 2005) suggest that it extends to the Central Basin (Figure 1).
The surface rupture of the 1999 magnitude 7.4 Izmit earthquake extends for about 110 kilometers, from the Gulf of Izmit in the west (Figure 1) toward the east (Barka et al. 2002). However, the western termination of the 1999 event is also debated. According to some researchers (e.g., Armijo et al., 2005; Uçarkuş et al., 2011), the surface rupture of the 1999 earthquake terminated in the Çınarcık Basin, but Kozacı and Altunel (2022) claim that the rupture did not continue further west of the Hersek Peninsula (Figure 1).
No large earthquake (magnitude 7.0 or greater) has occurred during the instrumental period on the segments of the northern branch of the North Anatolian Fault Zone between the Central Basin in the west and the Hersek Peninsula in the east. The April 23, 2025 magnitude 6.2 earthquake occurred on the western part of the Kumburgaz segment that extends between the Central and Çınarcık basins (Figure 1).
The instrumental period of seismicity, with four moderately-sized earthquakes, includes the latest 2025 event, the 1935 Marmara Island earthquake (magnitude 6.3), the 1963 Çinarcık Basin earthquake (magnitude 6.3), and the 2019 offshore Silivri earthquake (magnitude 5.7). The three earlier earthquakes are comparable in magnitude to the April 2025 event (Figure 6).
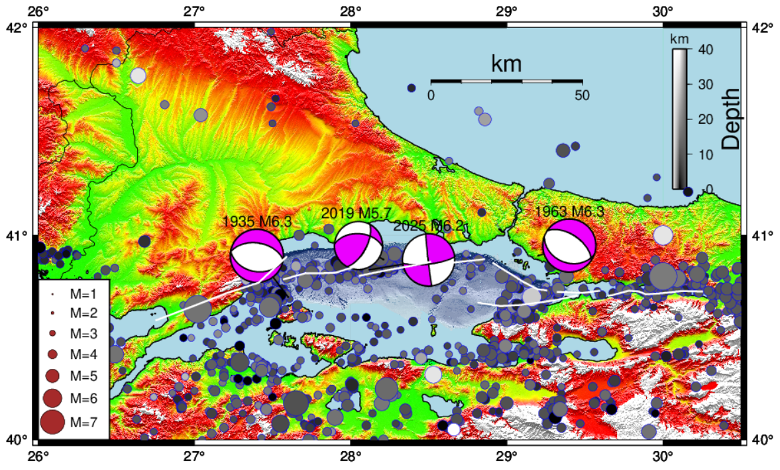
The previous largest instrumental-period earthquake on the Kumburgaz segment took place on September 26, 2019, with a magnitude of 5.7. This offshore event, called the Silivri earthquake, ruptured a secondary fault that lies north of the main trace of the North Anatolian Fault. The fault plane solution of the earthquake shows strike-slip faulting with a significant reverse faulting component (Figure 6), despite its proximity to the main fault. Stein and Sevilgen (2025) studied the possible interaction between this event and the 2025 mainshock and pointed out a significant stress increase at the lower part of the ruptured fault plane.
Among the four moderate-sized earthquakes that have occurred on or near the Kumburgaz segment since 1900, only the 2025 magnitude 6.2 event, which the USGS reported as a strike-slip earthquake, ruptured a section of the main trace of the North Anatolian Fault Zone. The east-west trending nodal plane of the focal mechanism fits very well with the geometry of the main fault trace in that region (Figure 6).
The last major earthquake to strike the Kumburgaz segment occurred in 1766, as mentioned in the previous section. The eastern portion of the fault segment likely experienced a stress increase after the April 2025 event. Both of these factors have likely increased the already-high risk in the Istanbul metropolitan area and the highly populated Marmara region.
Hazard and Risk Assessment
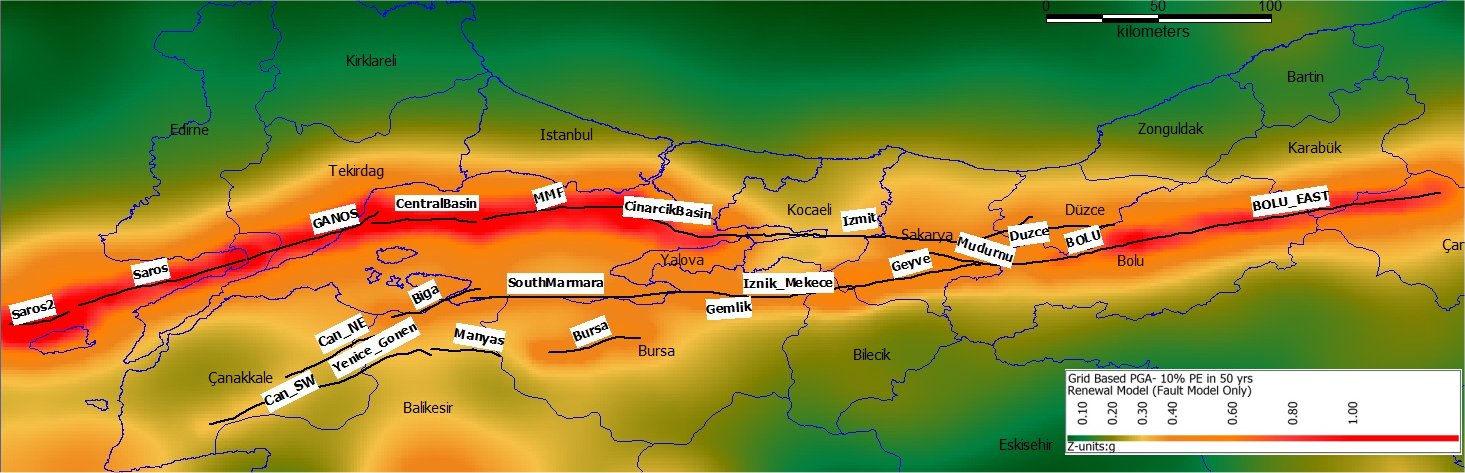
The 1999 Izmit earthquake highlighted the need for specialized probabilistic seismic hazard assessment models tailored for Turkey’s Marmara region. One of the most state-of-the-art hazard assessments for this region is the Sesetyan et al. (2019) study. It integrates updated databases and a refined fault segmentation model with alternative earthquake rupture models (under both Poisson and renewal assumptions) and background seismicity that is represented by smoothed seismicity. The study also incorporates recently derived global and regional ground motion prediction equations to enhance the accuracy of hazard evaluations.
Figure 7 shows the seismic hazard in the Marmara region in terms of peak ground acceleration in units of gravitational acceleration (g) for B-C boundary site class (this site class is defined per the NEHRP code as having a time-averaged shear wave velocity in the upper 30 meters of the soil profile, or VS30, of 760 meters per second) and a 10% probability of exceedance in 50 years (derived from the fault-based source model with time-dependent methodology).
As can be seen, the peak ground acceleration level on the shores of the Marmara Sea varies between 0.4 g and 0.8 g, which is in conformity with the Turkish earthquake-resistant design code (0.5 g is half Earth’s gravitational acceleration).
The segment of the North Anatolian Fault beneath the Sea of Marmara (Main Marmara Fault) constitutes a recognized seismic gap that has remained quiet since the 18th century (e.g., Barka et al., 2002, Meghraoui et al., 2012). Its proximity to the Istanbul metropolitan region means a high seismic hazard for the city (e.g., Parsons et al., 2000).
A high-magnitude seismic event, comparable to the 1999 Izmit earthquake (magnitude 7.4), is anticipated along the Main Marmara Fault (e.g., Oglesby and Mai, 2012; Aochi and Ulrich, 2015). The probability of occurrence of an event with a magnitude of 7.0 or greater affecting Istanbul within a 30-year period is about 40% to 50% under the time-dependent interaction model (Parsons et al., 2000; Murru et al., 2016).
In addition to looking at 30-year increments, we can express these likelihoods as annual probabilities, which are often expressed as exceedance probabilities — the chance that a given intensity of shaking will be surpassed in any given year. Annual probabilities are between 1.7% to 2.3%, or about 10 times the probability associated with the earthquake ground motion used in the earthquake-resistant design of buildings (i.e., 475-year average return period). In other words, the earthquake ground motion intensity expected in Istanbul under Poissonian conditions (a model “without memory”) with an average return period of 475 years is now expected to occur with an average return period of about 50 years (nearly one tenth the 475 years) due to the stress transfer form the 1999 Izmit earthquake (a model “with memory”). Consequently, comprehensive seismic hazard assessments and the development of risk mitigation strategies remain critical components of regional disaster preparedness for Istanbul.
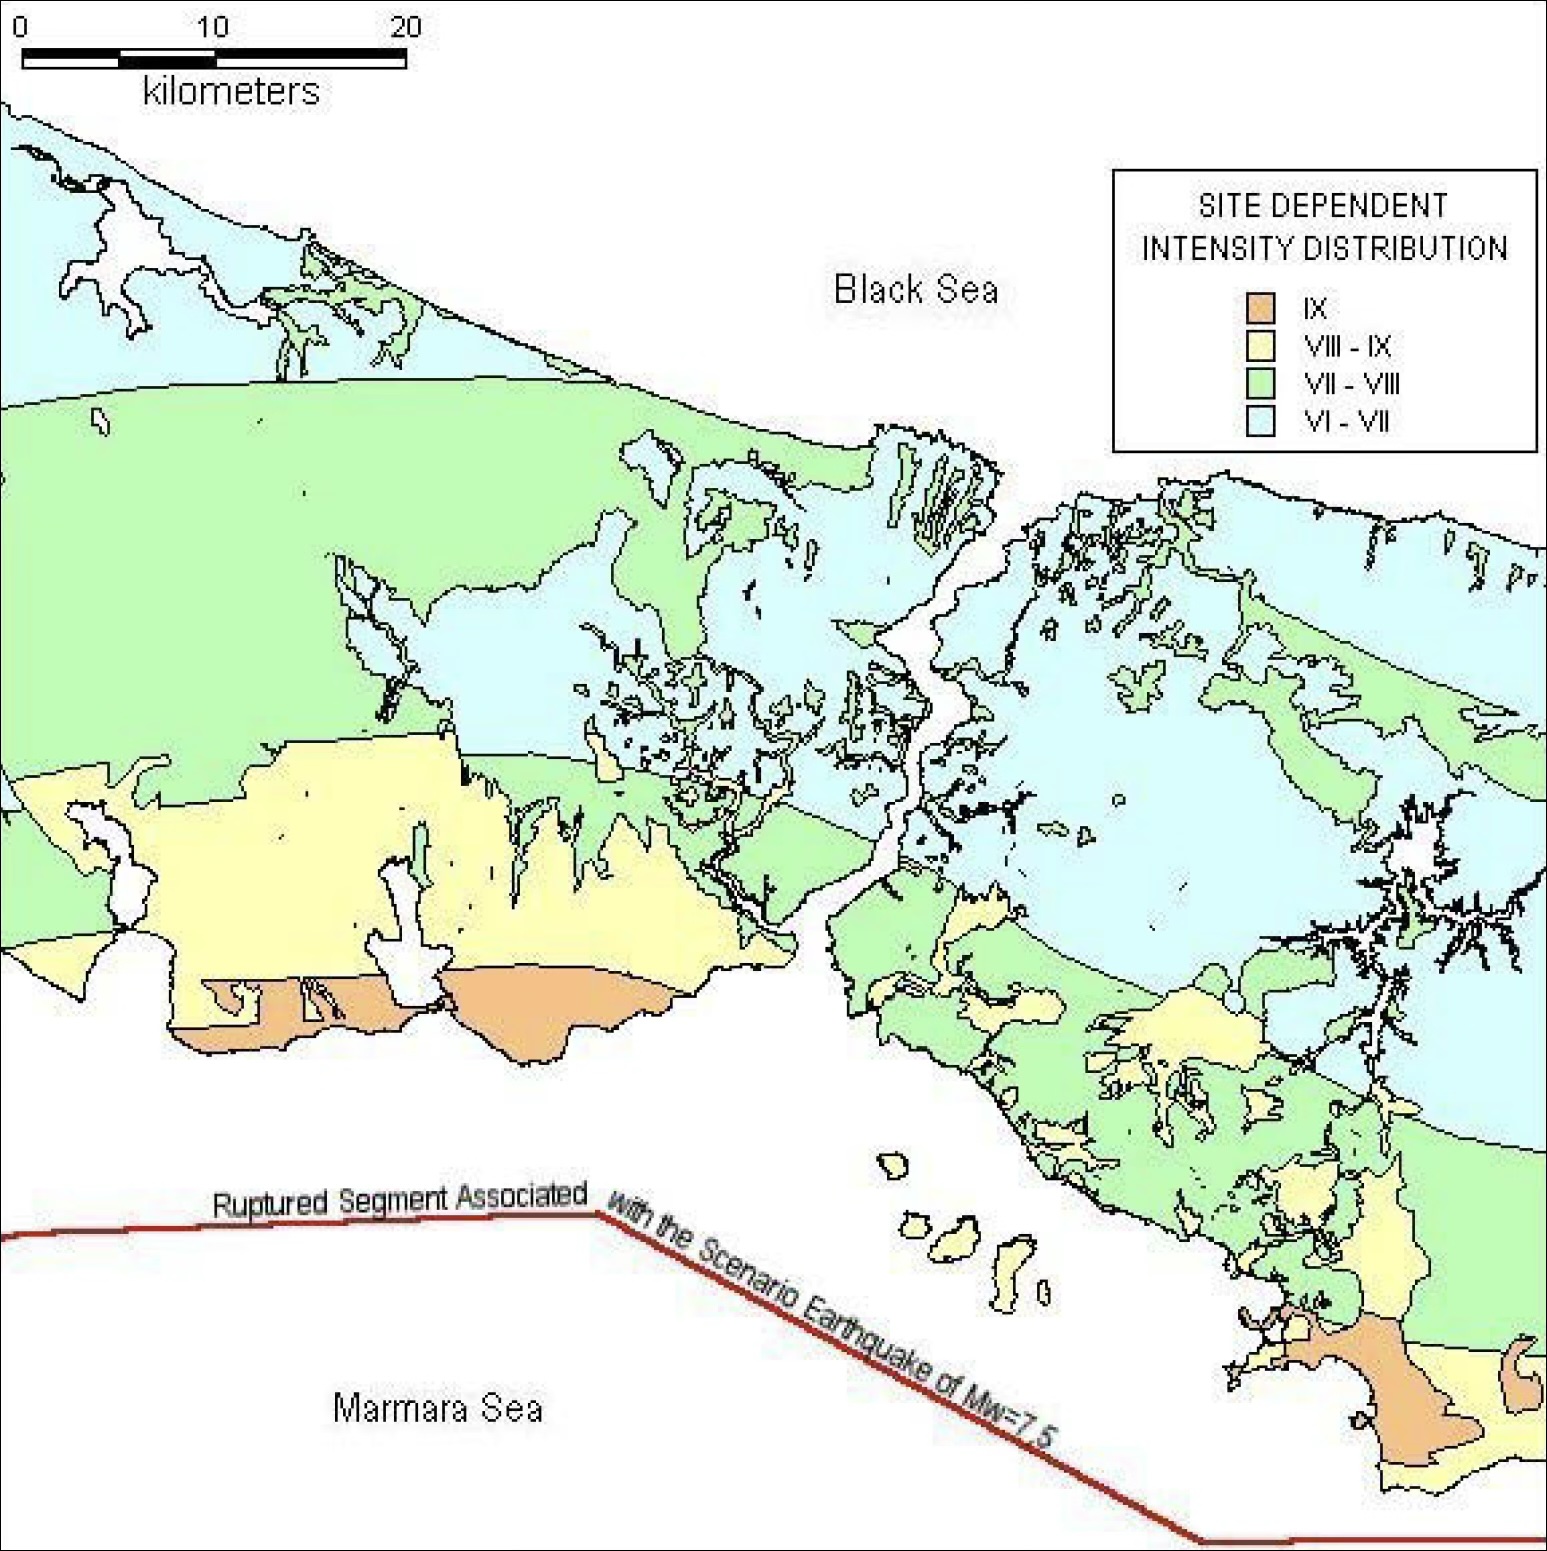
Another way to elaborate on the seismic risk in Istanbul is to test the potential damage to the building stock for a single scenario earthquake. As an example of this, a study of the comprehensive earthquake risk assessment for Istanbul was conducted by Boğaziçi University, OYO International, and GRM Ltd. for Istanbul Metropolitan Municipality (IBB, 2009). This study was updated in 2018 by Boğaziçi University (IBB, 2018). This study was based on a single scenario earthquake — a magnitude 7.5 event rupturing the Main Marmara Fault. The study found that, in a deterministic assessment of shaking intensities (Figure 8), an average median MMI (Modified Mercalli Index, a measure of shaking intensity) of about VIII (violent shaking) would be applicable to shore areas of the European part of the city (the western half of Istanbul located on the European mainland).
In order to understand how the shaking intensity translates into building damage, we used empirical earthquake fragility of reinforced concrete residential apartment buildings, which are typical in Istanbul. We used the empirical fragility data shown in Figure 9, obtained from the distribution of damage associated with the 1999 Izmit earthquake and tested with the damage from the 2023 Kahramanmaraş earthquakes.
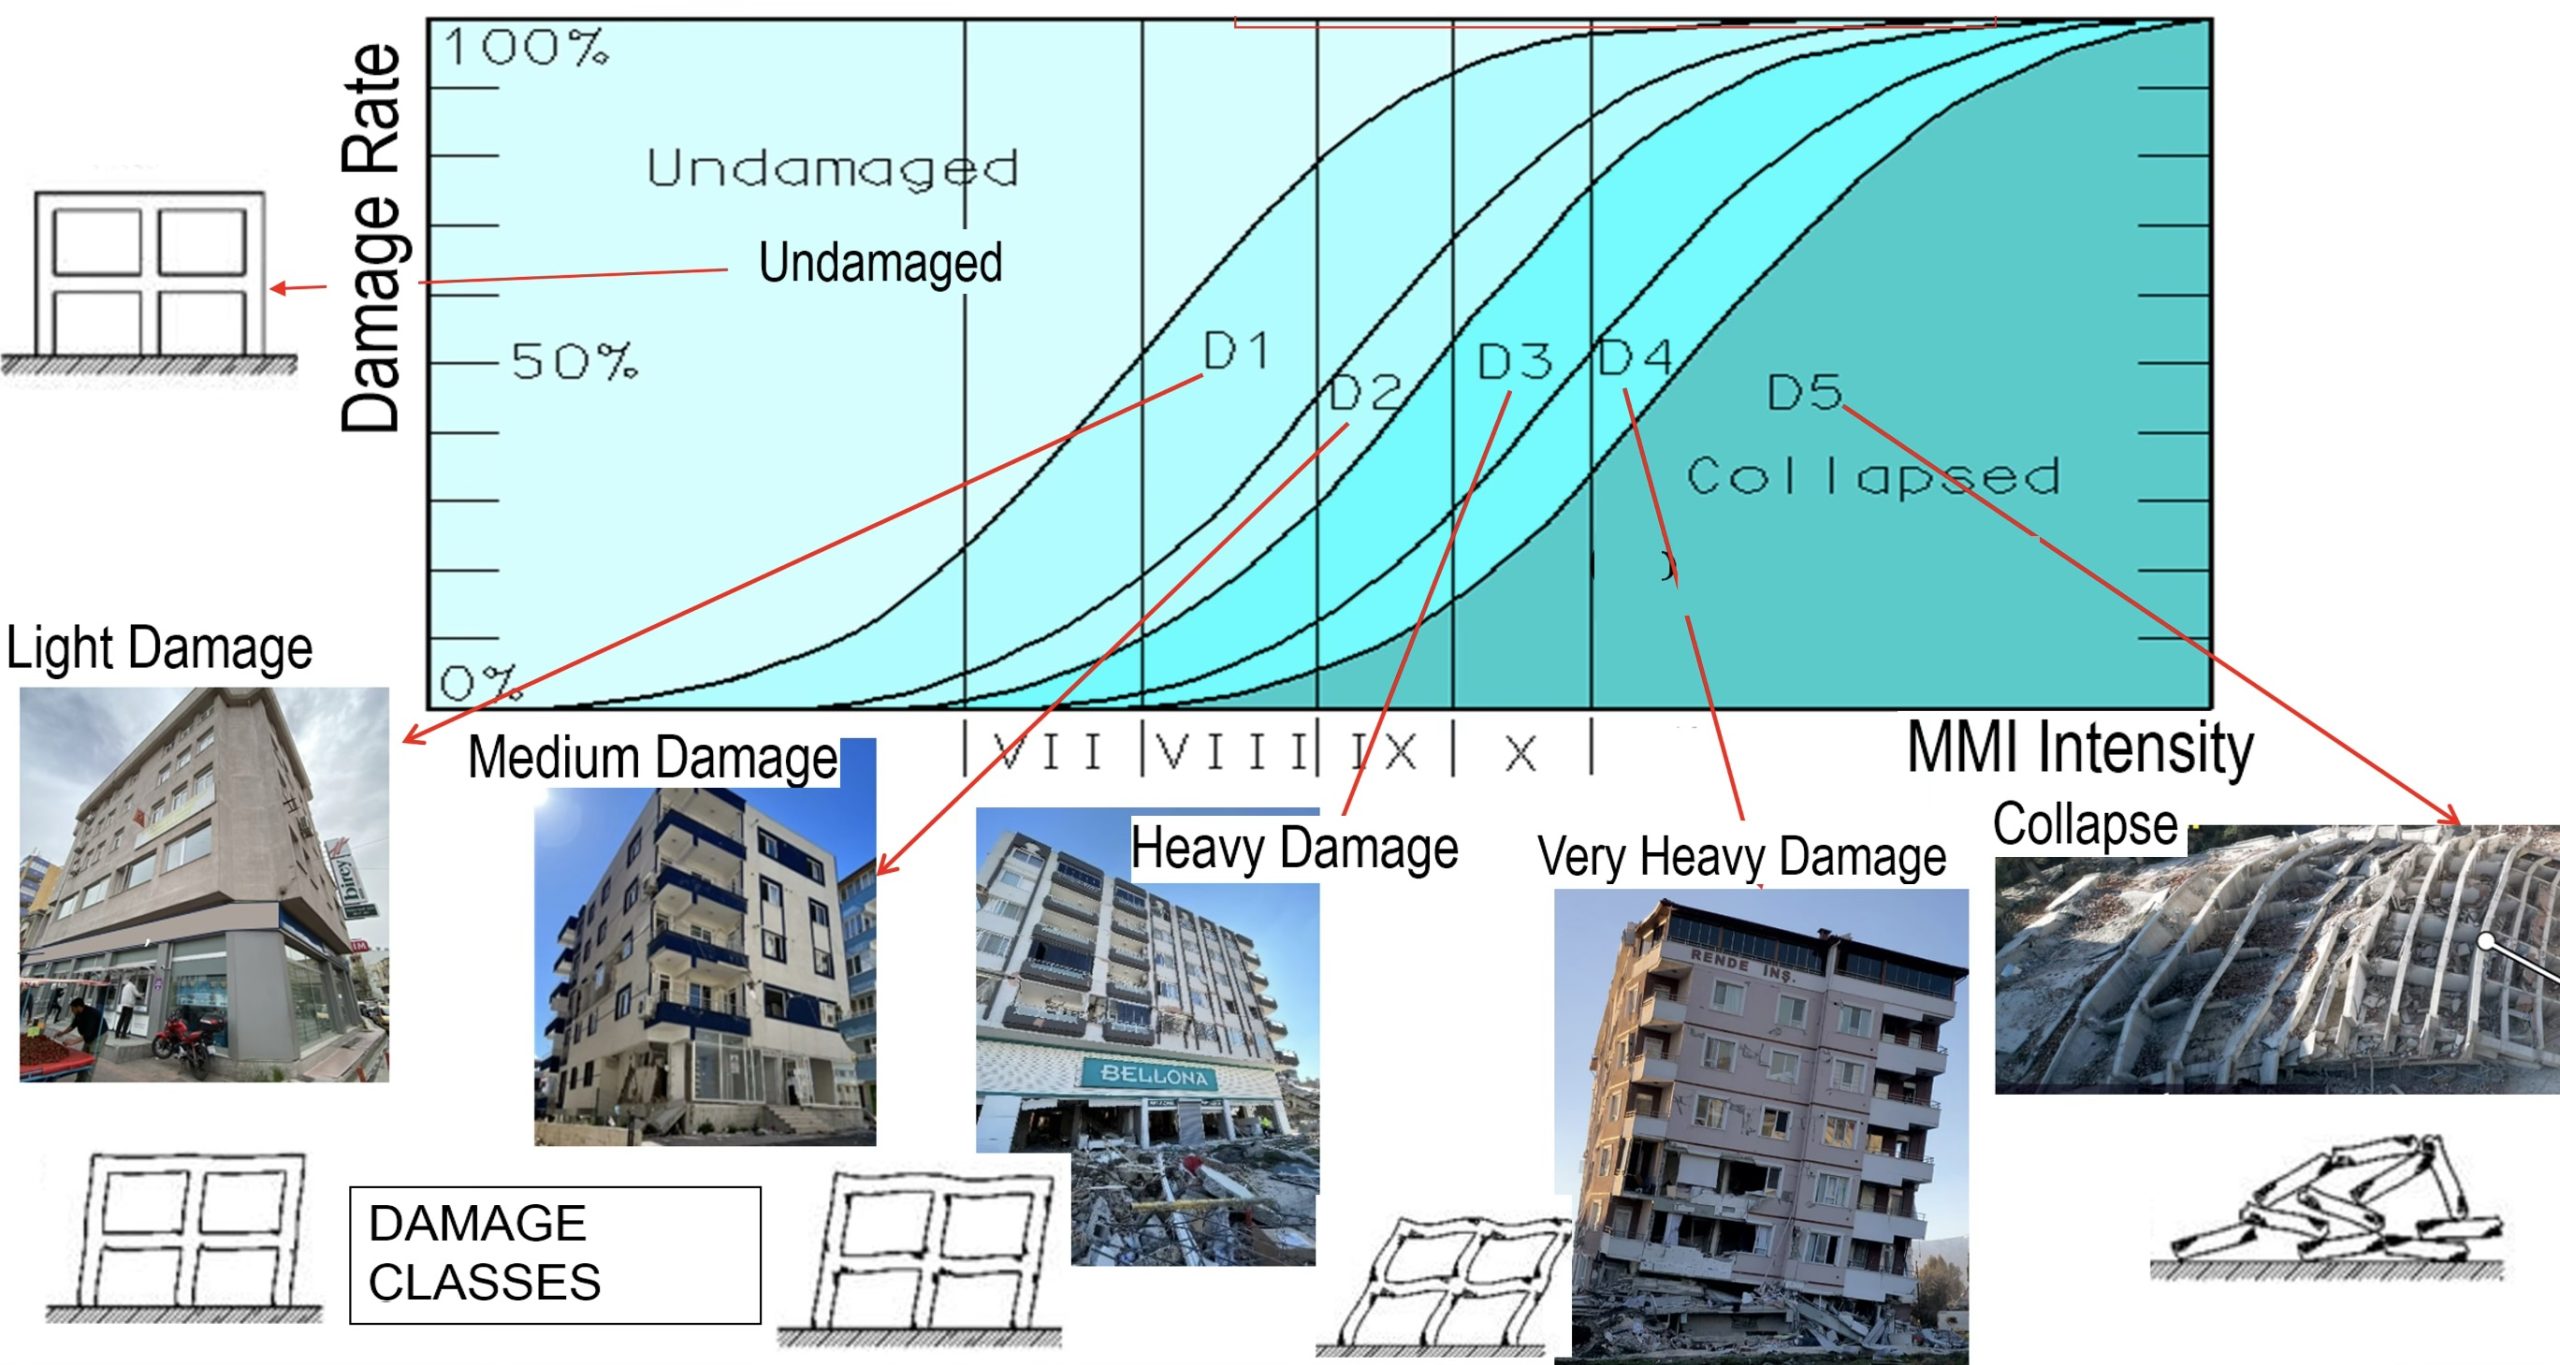
Assuming an average MMI of VIII in the southern half of the map in Figure 8 (where the bulk of the built-up sections of Istanbul are located), the fragility relationship in Figure 9, would indicate that about 17% of the buildings would be damaged heavily and about 2% would collapse.
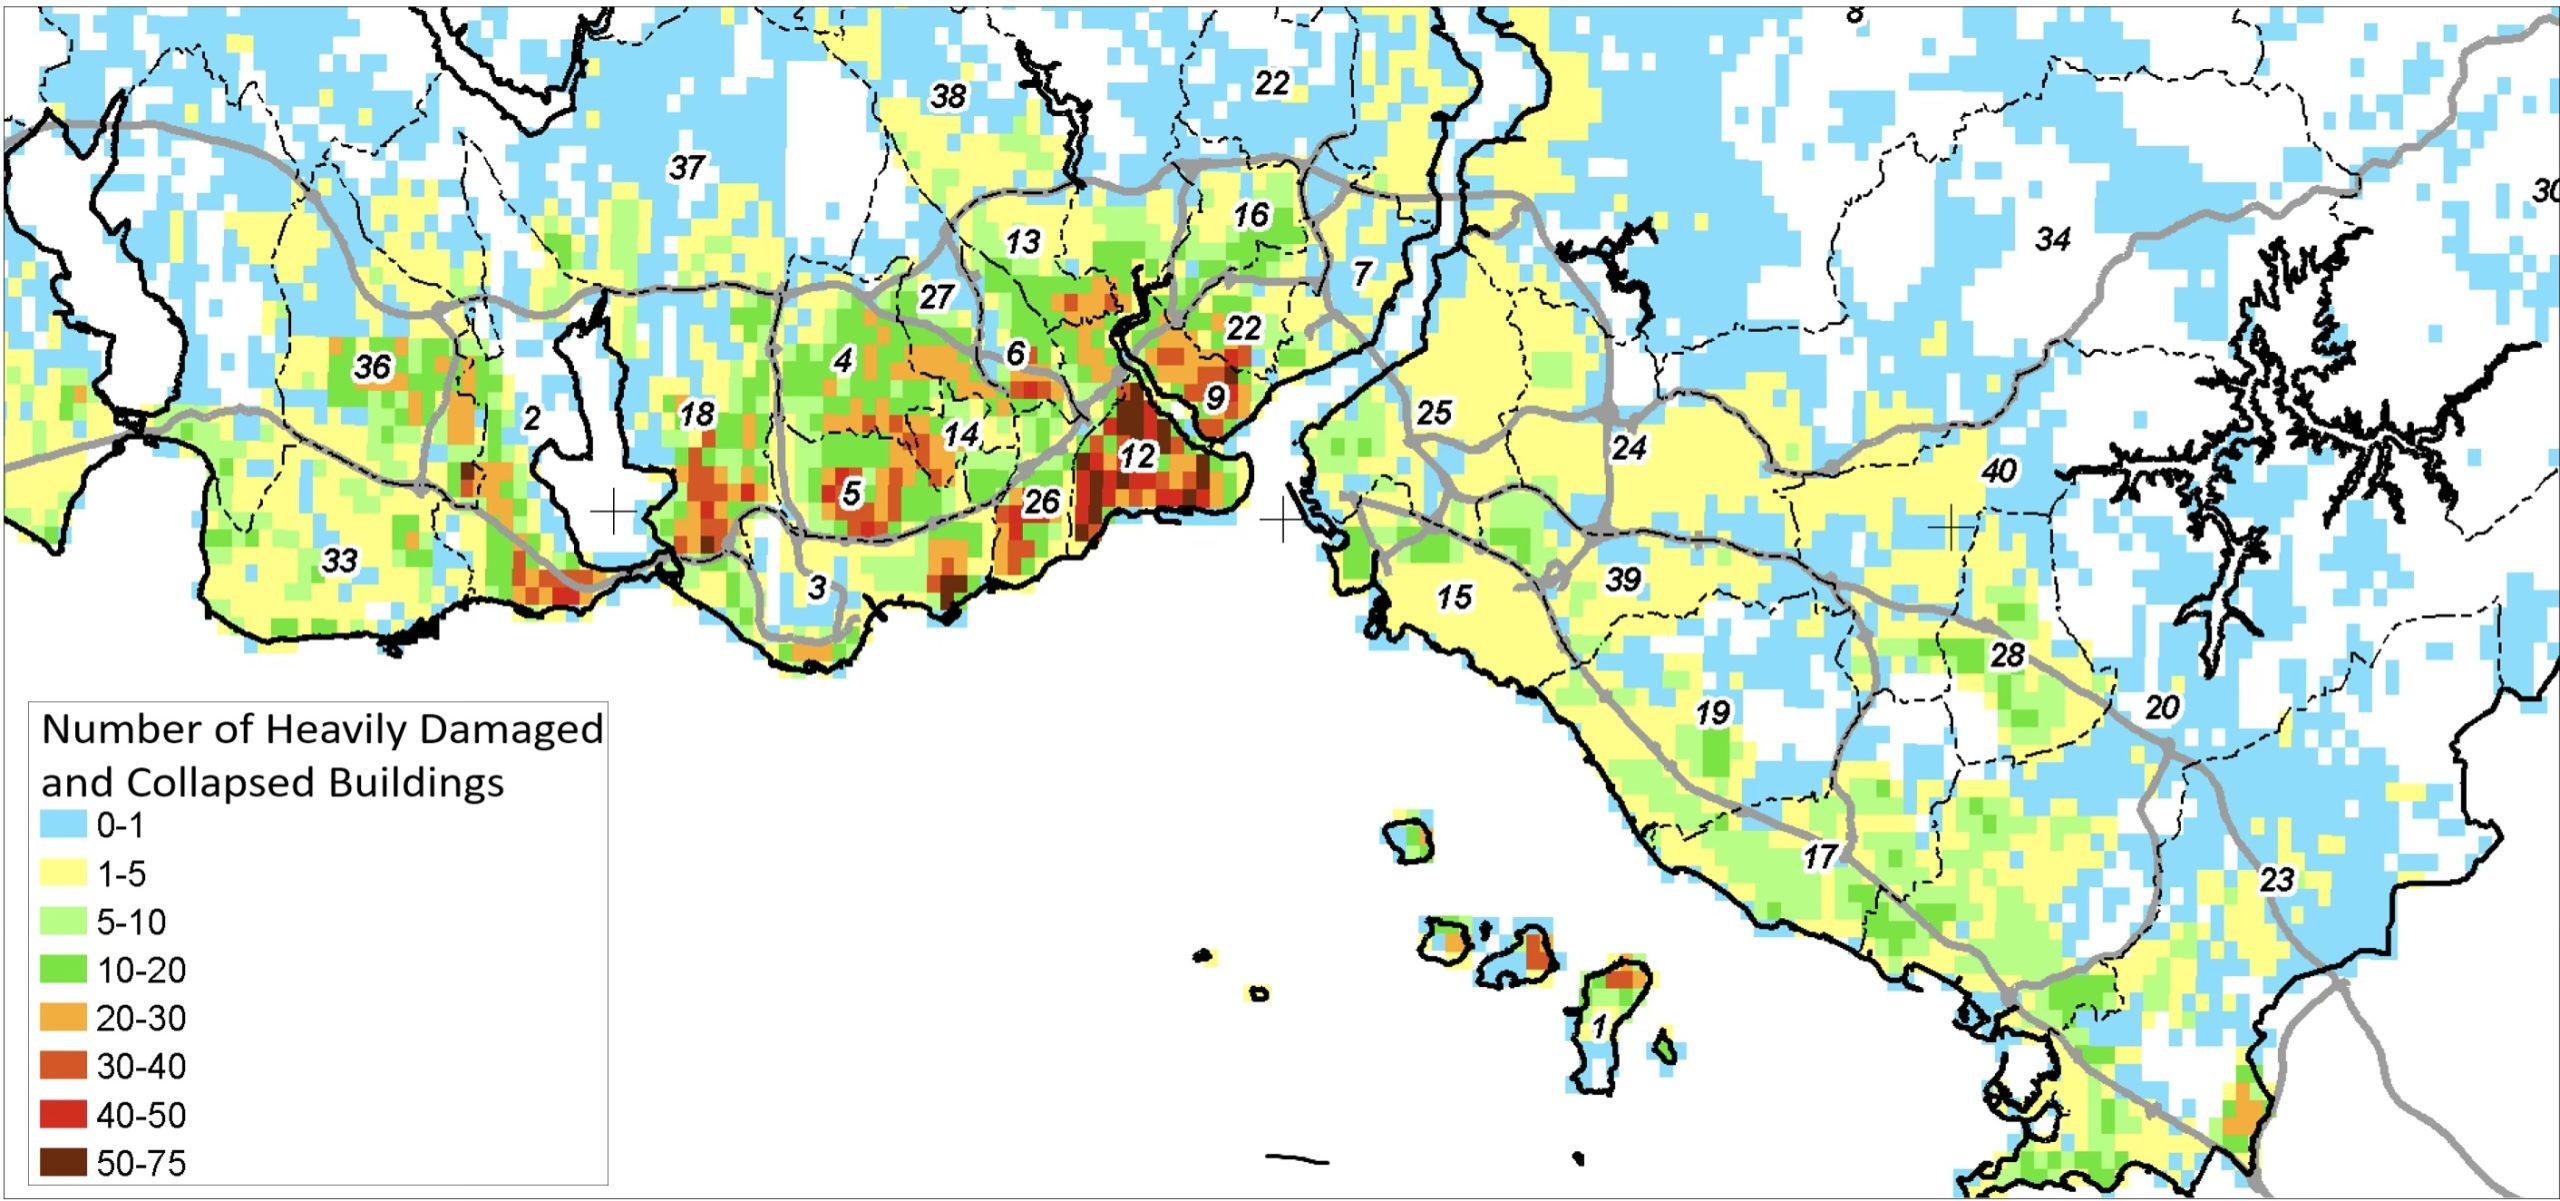
The IBB (2009) study used intensity and spectral acceleration-based fragilities. Loss ratios for the buildings, as well as other losses, were determined for 0.005° cells (about 500 meters by 300 meters), for median and 84-percentile probabilities. Figure 10 shows the results for heavily damaged and collapsed buildings.
In addition to this magnitude 7.5 scenario earthquake, the IBB (2018) study also considered stochastic ground motion simulations for several rupture alternatives and the code-based probabilistic seismic hazard assessment map for different return periods. Aggregate building damage predictions obtained from different rupture scenarios do not differ much from results of the magnitude 7.5 scenario earthquake (Figure 8).
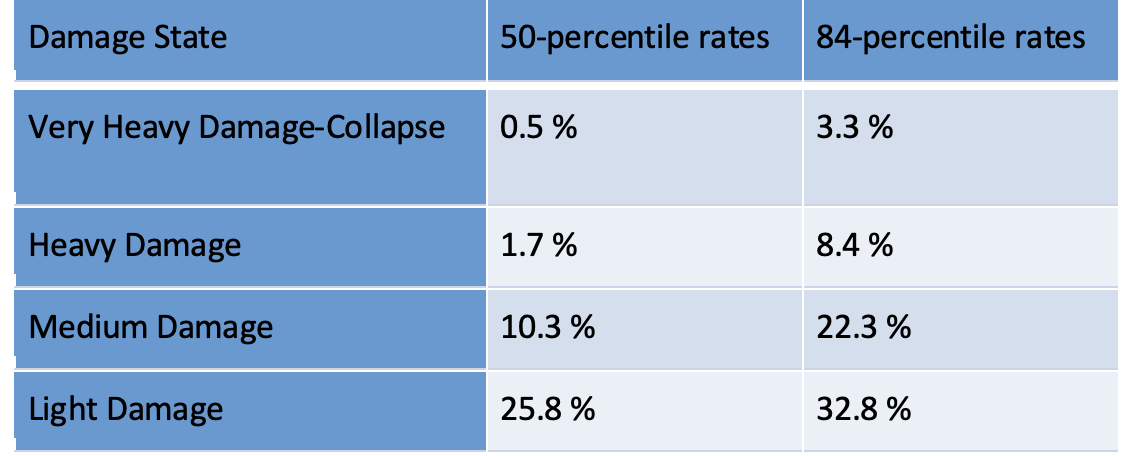
Table 1 shows the building damage rates that would result from the occurrence of a magnitude 7.5 Marmara earthquake. Assuming a normal distribution of building damage states, the 50-percentile (median) and 84-percentile (median plus one standard deviation) indicate that the probability of exceedance of being in the given damage state is, respectively, 50 percent and 16 percent. This table tells us that out of 1.2 million buildings in Istanbul, about 30,000 (median) and 140,000 (84-percentile) buildings would need to be demolished and re-constructed in this scenario (any building with heavy damage or worse). The number of buildings that would be safe after retrofit (medium damage and higher) amounts to 150,000 (median) and 408,000 (84-percentile).
Table 1. Building damage rates that would result from the occurrence of a magnitude 7.5 earthquake in the Marmara Sea. Credit: IBB (2009)
Strong Ground Motion
During the April 25, 2025 mainshock, strong motion acceleration data was recorded by AFAD, KOERI, and the Istanbul Natural Gas Network stations. For preliminary evaluation of peak ground acceleration and peak ground velocity values from these recordings, 195 AFAD stations with measured VS30 values were selected. Recall that VS30 is used to account for site conditions at seismic stations.
To calculate finite fault distances between these stations and the ruptured fault, the geometry of the fault rupture plane is required. For this work, the fault length was estimated to be approximately 25 kilometers based on aftershock distributions and magnitude-scaling relationships (Wells and Coppersmith, 1994; Leonard, 2014; Thingbaijam et al., 2017). Accordingly, extended source-to-site distance metrics, including rupture distance (RRUP) and Joyner-Boore distance (RJB), were computed following the procedure described by Kaklamanos et al. (2011), utilizing these provisional rupture plane parameters. The fault plane parameters used in these calculations were retrieved from the Global CMT moment tensor catalog (depth: 12 kilometers; strike: 83 degrees; dip: 84 degrees; rake: -175 degrees).
Figure 11 provides a comprehensive overview of the distribution of the entire ground motion dataset. Specifically, it illustrates the RJB – VS30 distribution of the recordings, as well as their histograms. The distribution illustrates the range and density of records across both distance and site class, which is essential for assessing the dataset’s reliability in ground motion analyses.
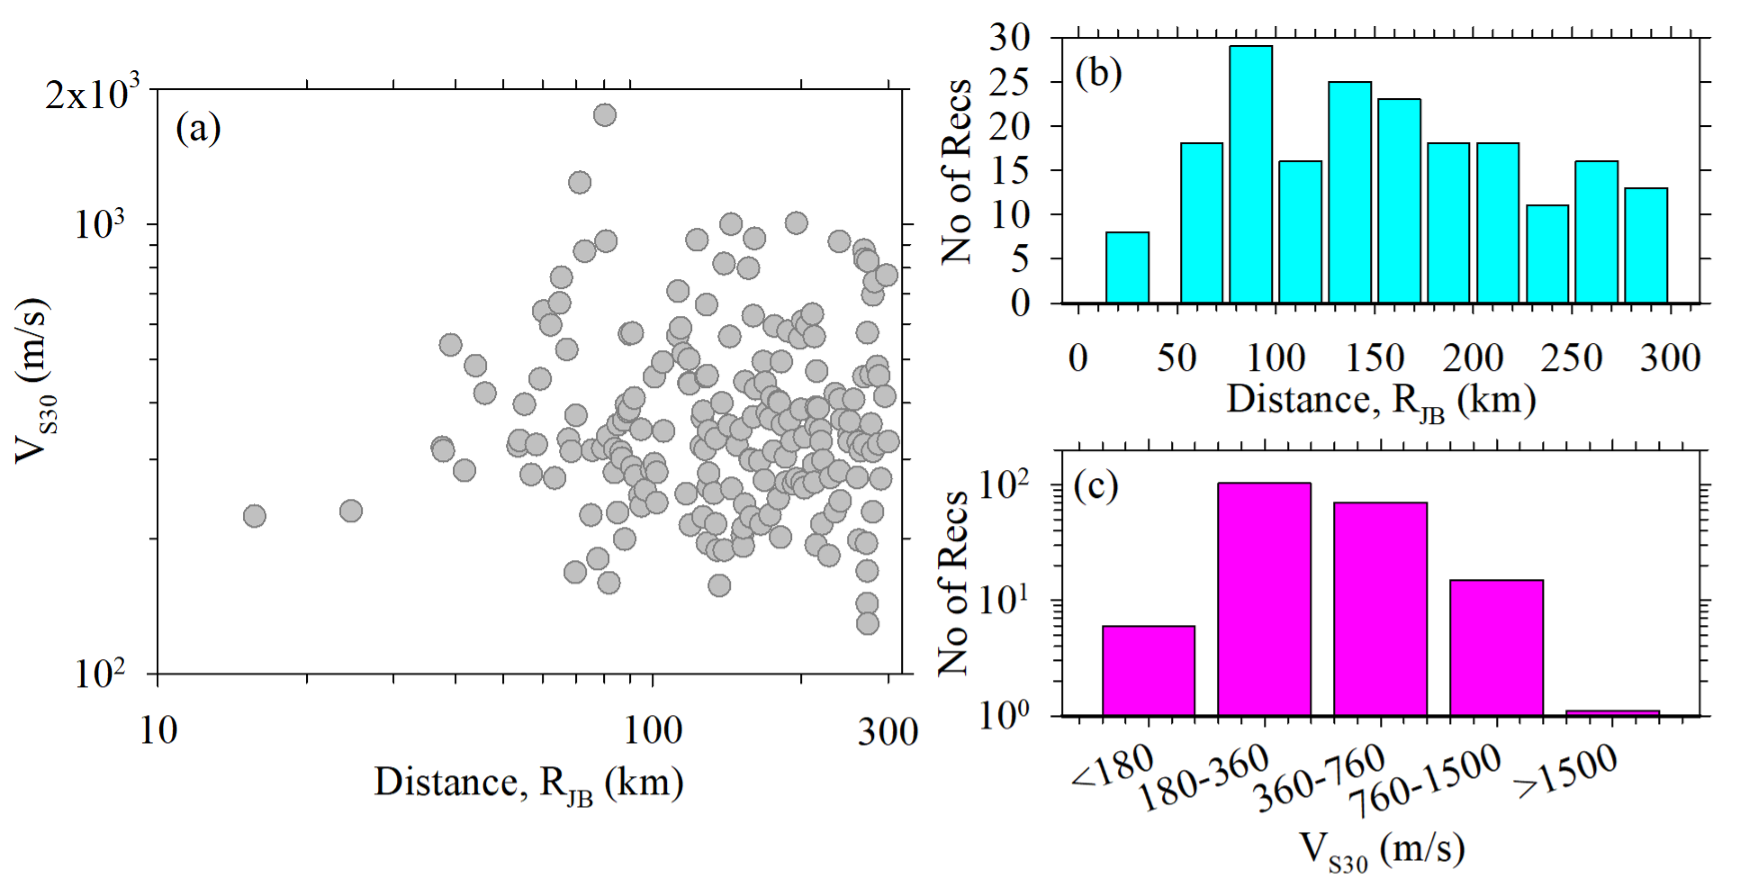
As depicted, most stations fall within site classes ZD (180 meters per second < VS30 < 360 meters per second) and ZC (360 meters per second < VS30 < 760 meters per second). These classes follow the Turkish Building Earthquake Code (2018; TBEC18), which employs a similar site classification scheme to ASCE 7-16 (ASCE/SEI 7–16, 2017). Remaining stations belong to site classes ZE (VS30 < 180 meters per second) or ZB (760 meters per second < VS30 < 1,500 meters per second), with only one station categorized as ZA (VS30 = 1,747 meters per second). The dataset does not contain any ground motion recordings from stations located within 10 kilometers (RJB < 10 kilometers) of the fault rupture for this earthquake. Approximately 95% of the stations are situated at distances greater than 50 kilometers (RJB) from the fault rupture.
Comparison of Recorded and Predicted Ground Motions
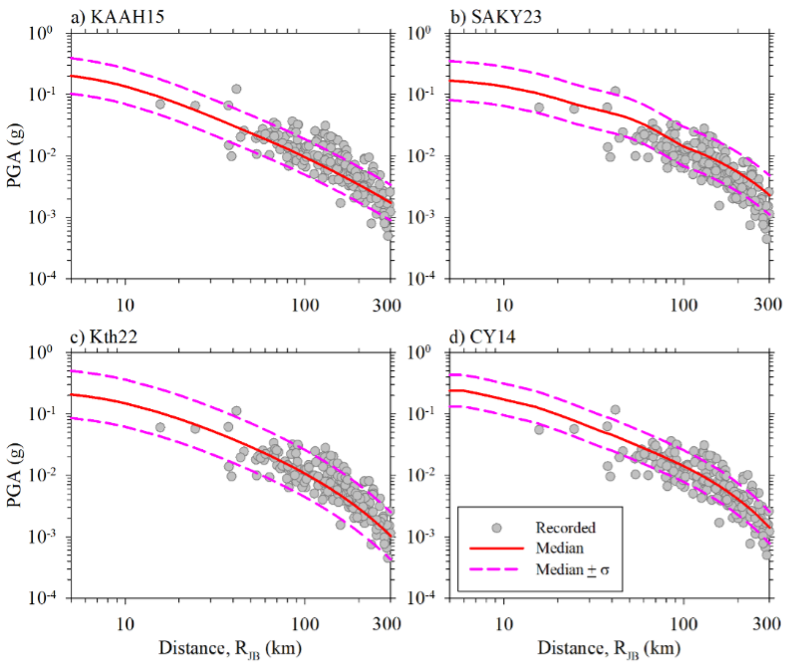
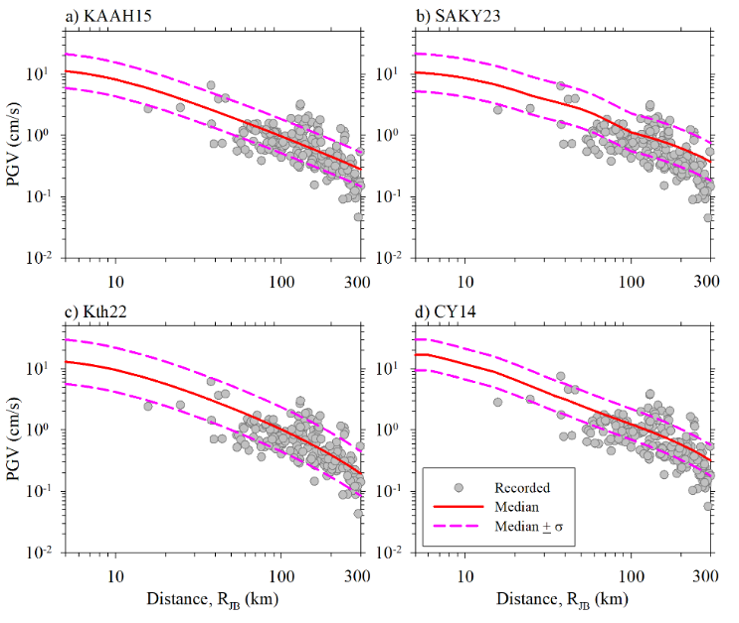
This section evaluates the compatibility of recorded peak ground acceleration and peak ground velocity values with selected local, regional, and global ground motion model predictions based on the compiled database. The ground motion models selected for this study include the Türkiye prediction model by Kale et al. (2015; KAAH15), the Marmara region model by Sandıkkaya et al. (2023; SAKY23), the Pan-European model by Kotha et al. (2022; Kth22), and the global NGA-West2 model by Chiou and Youngs (2014; CY14).
Figure 12 and Figure 13 present distance scaling comparisons between recorded ground motions and ground motion model predictions for peak ground acceleration and peak ground velocity, respectively. Ground motion model predictions are shown with median values accompanied by ±1 standard deviation (σ) for each model, whereas the scatter points represent the recorded peak amplitudes. The recorded ground motions are converted to reference rock site conditions (VS30 = 760 meters per second) using site amplification factors calculated individually for each recording and each ground motion model.
To provide a comprehensive and objective assessment, Figure 14 illustrates the mean-binned (distance) total residual distribution (Rij) for peak ground acceleration and peak ground velocity without applying any site corrections to the recorded amplitudes. Note that in this figure, negative residual values indicate an overprediction by the GMM, whereas positive residual values signify an underprediction.
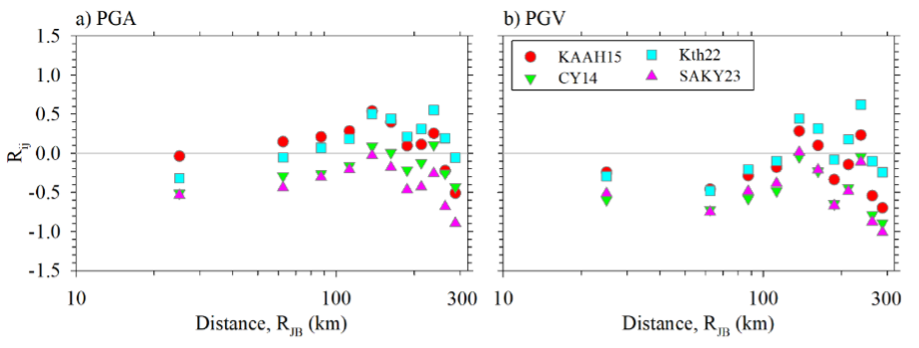
Regarding peak ground acceleration (Figure 14a), we observe that the KAAH15 and Kth22 models exhibit superior performance compared to the others within approximately the first 100 kilometers, indicated by residuals clustering around zero. Between 100 and 175 kilometers, CY14 and SAKY23 yield lower residual values, suggesting better agreement with the observed data. In the 175 to 225 kilometer range, both KAAH15 and CY14 models maintain relatively stable performance, although variability increases. Beyond 225 kilometers, a noticeable degradation in model performance is evident across all models. It is worth noting that the recommended upper distance limit for the KAAH15 model is 200 kilometers, whereas other models apply to between 300 and 400 kilometers. This pattern highlights that the anelastic attenuation rate inferred from the recorded motions is significantly higher than those assumed in the GMMs, leading to overestimated predictions at large distances.
A similar trend is noted for peak ground velocity (Figure 14b); however, peak ground acceleration residuals (Figure 14a) remain generally lower up to approximately 125 kilometers. The KAAH15 and Kth22 models demonstrate relatively better agreement with the recordings within this range, as evidenced by smaller residual values compared to the other ground motion models. The KAAH15 model, in particular, exhibits a stable performance around zero mean residuals between 100 to 225 kilometers. Between 125 kilometers and 250 kilometers, the residuals corresponding to CY14, SAKY23, and Kth22 display greater scatter relative to KAAH15, although their average trends generally remain close to zero. Beyond 225 kilometers, residuals become predominantly negative, indicating systematic overprediction by all ground motion models except Kth22, which continues to perform comparatively better. This observation further supports the inference that the actual attenuation of seismic energy with distance is stronger than what is assumed by the current ground motion model formulations.
Distribution of Ground Motion
The magnitude 6.2 earthquake triggered the Istanbul Earthquake Rapid Response and Early Warning System (Erdik et al., 2003) and the Istanbul Natural Gas Network Rapid Response and Risk Mitigation System (Zulfikar et al., 2016).
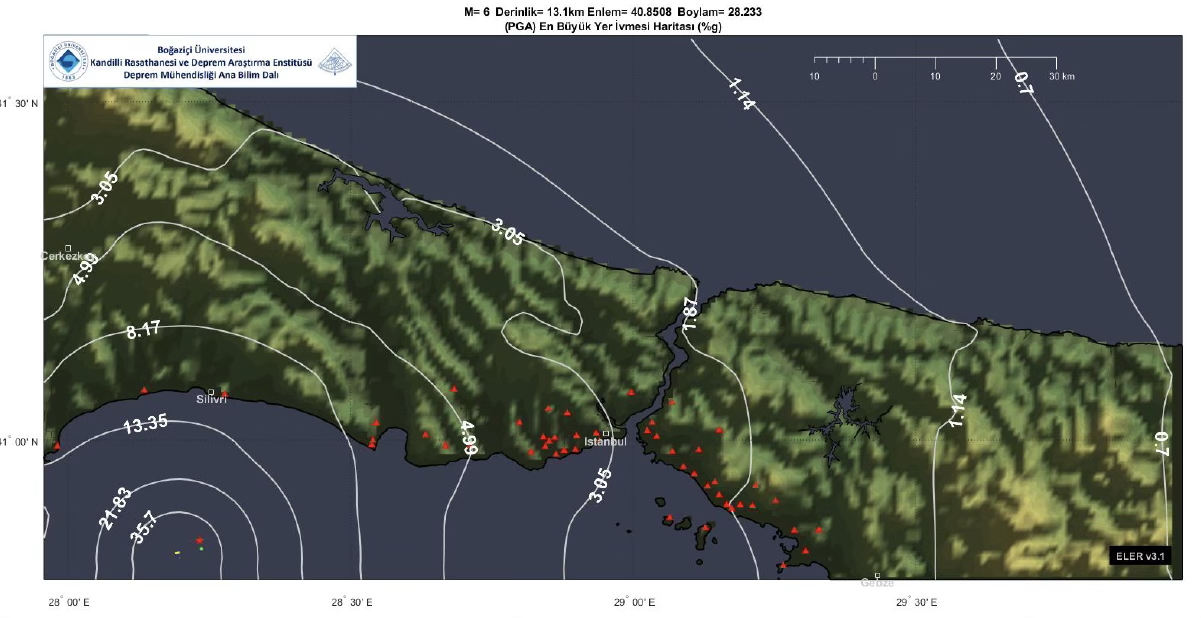
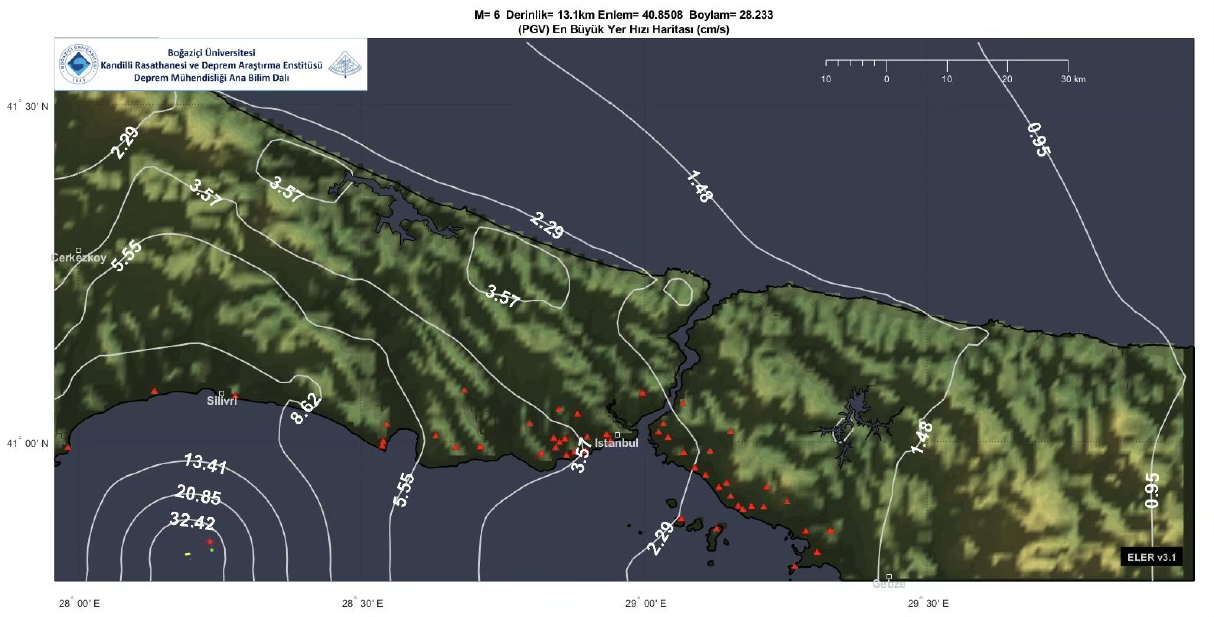
The Istanbul Earthquake Rapid Response and Early Warning System (IERREWS) currently consists of about 110 strong motion accelerographs used with the objective of providing early warning to both Marmaray Tube Tunnel (beneath the Bosporus Strait) and the Istanbul Gas System Network. It provides reliable information for accurate, effective characterization of shaking and damage by producing rapid post-earthquake maps to assist post-earthquake operations. The IERREWS results were appropriately reported by the Department of Earthquake Engineering of Kandilli Observatory and Earthquake Research Institute of Bogazici University (Bogazici University, 2025). Figure 15 provides the distribution of peak ground acceleration and peak ground velocity levels.
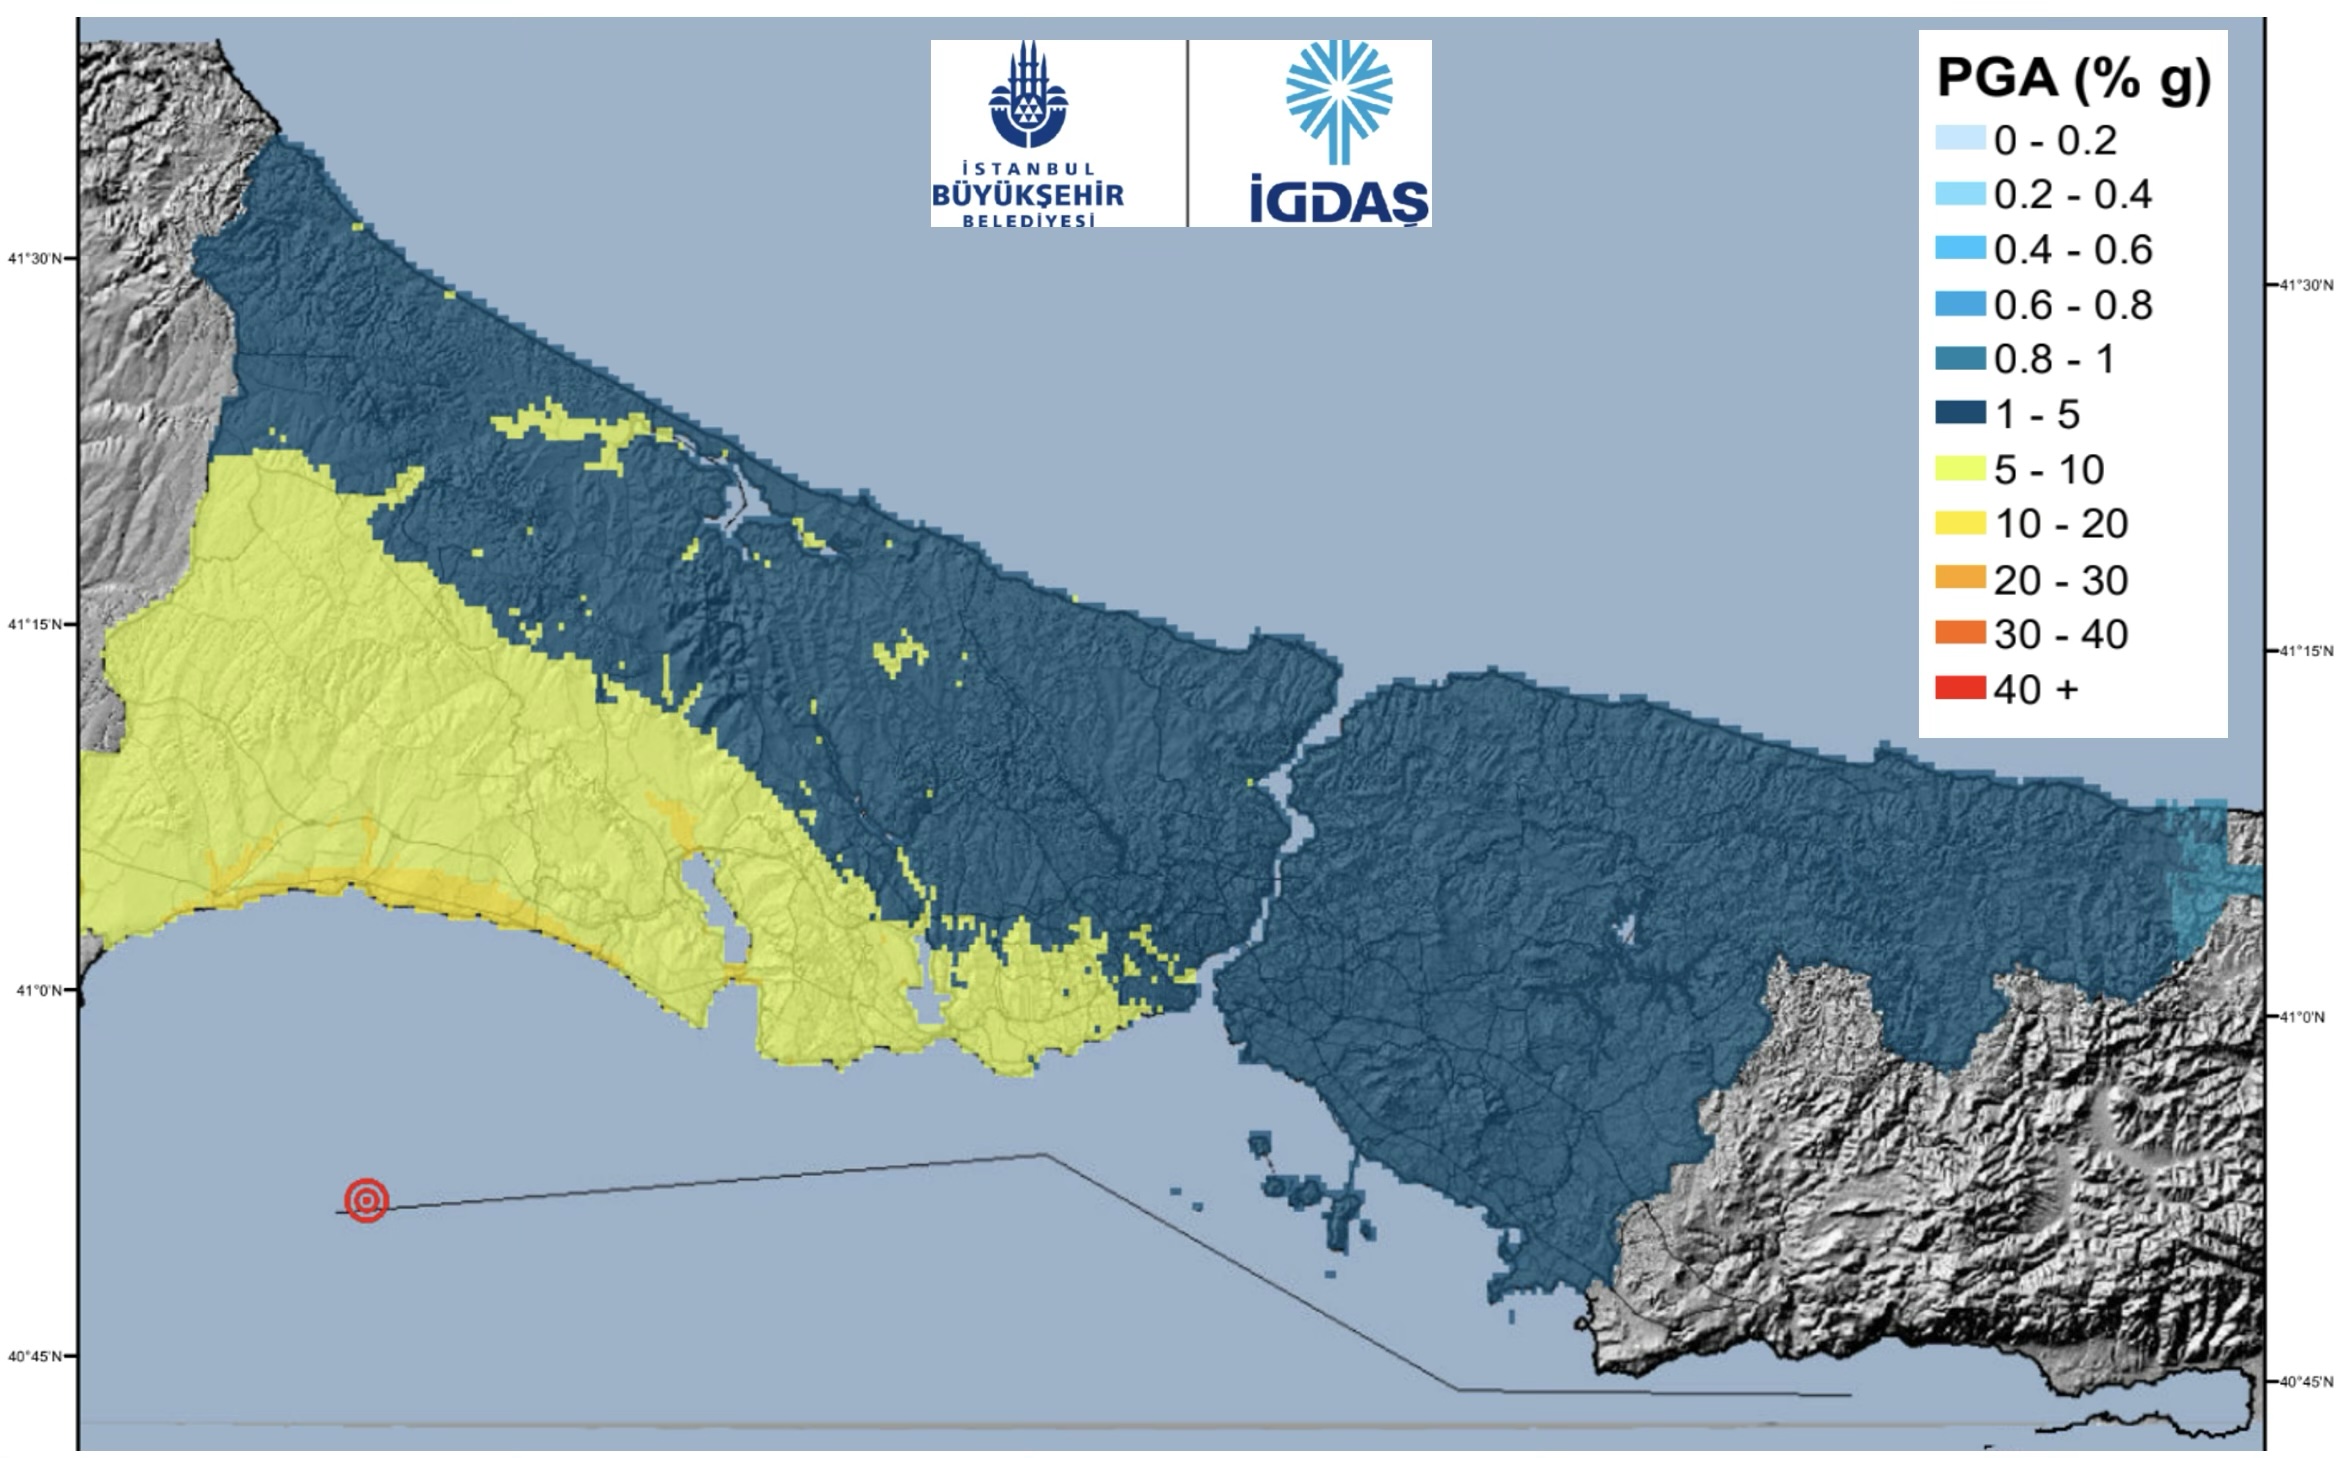
The Istanbul Natural Gas Network Rapid Response and Risk Mitigation System consists of almost 1,000 strong motion accelerometers located on the district gas regulator stations. Upon the trigger signal received from the IERREWS early warning system, the real-time algorithm at IGRAS checks the threshold levels of ground-motion parameters and interrupts the gas flow automatically if any exceedance is detected.
Then the IGRAS system: (1) produces near real-time earthquake hazard maps by using online strong-motion data from the strong-motion network in Istanbul; (2) estimates the distribution of damage to the natural gas network; and (3) transfers these damage distribution maps to stakeholders to enable rapid response teams to be dispatched to high damage areas. The magnitude 6.2 earthquake has served to test the first function of the system because the peak ground acceleration levels (Figure 16) were much below the thresholds for the second and third functions.
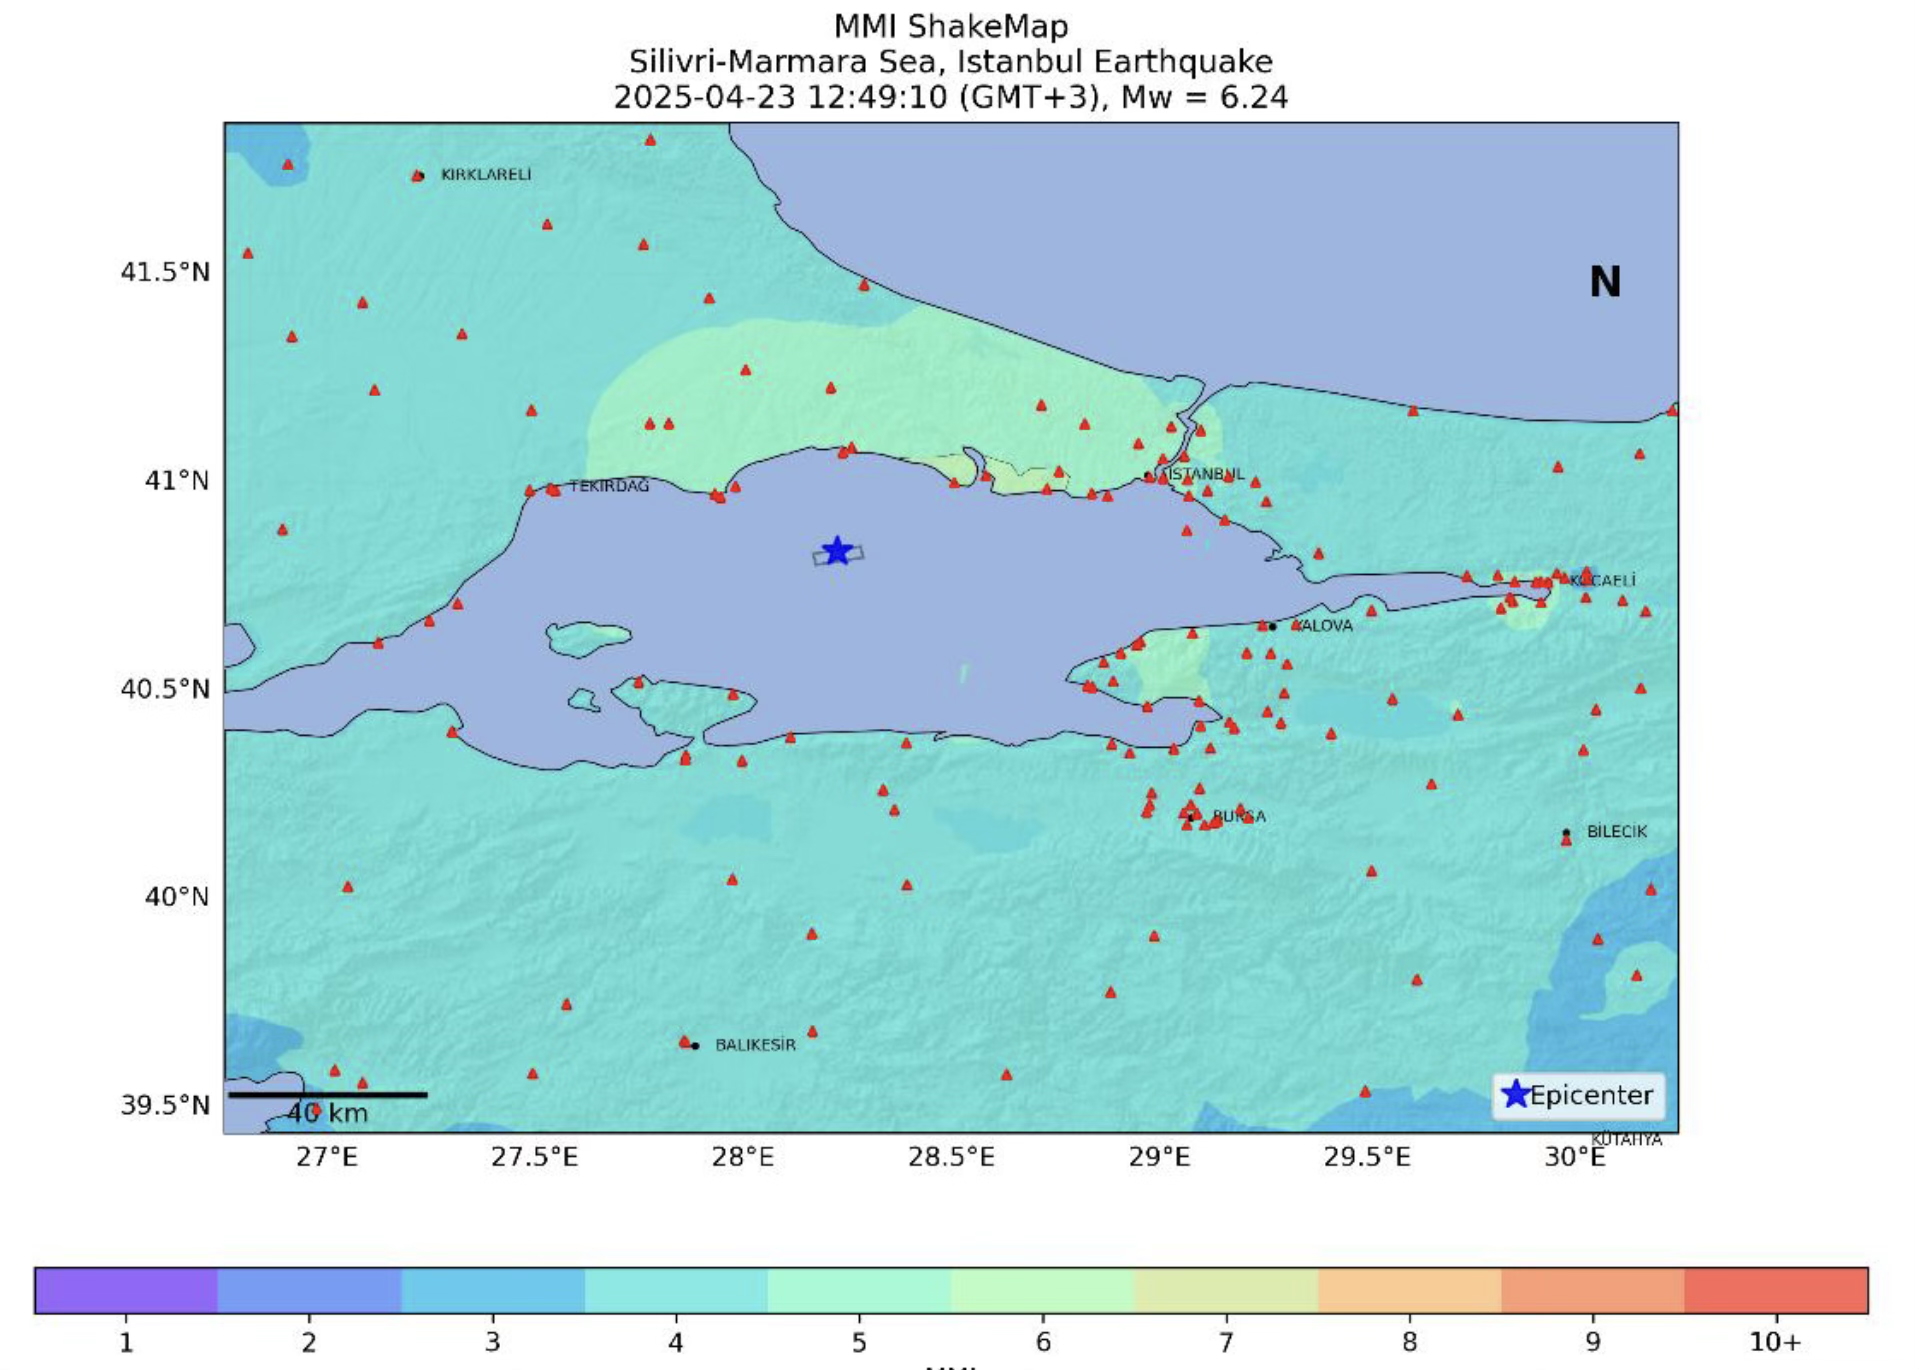
The CatMod software developed by T-Rupt Technology Inc. is also used to process the strong ground motion data, converting measured ground motion to instrumental MMI distribution (T-Rupt, 2025). In other words, this tells us which areas experienced what degree of shaking as measured by strong motion sensors (Figure 17).
Comparison with Building Code-Based Design Ground Motion
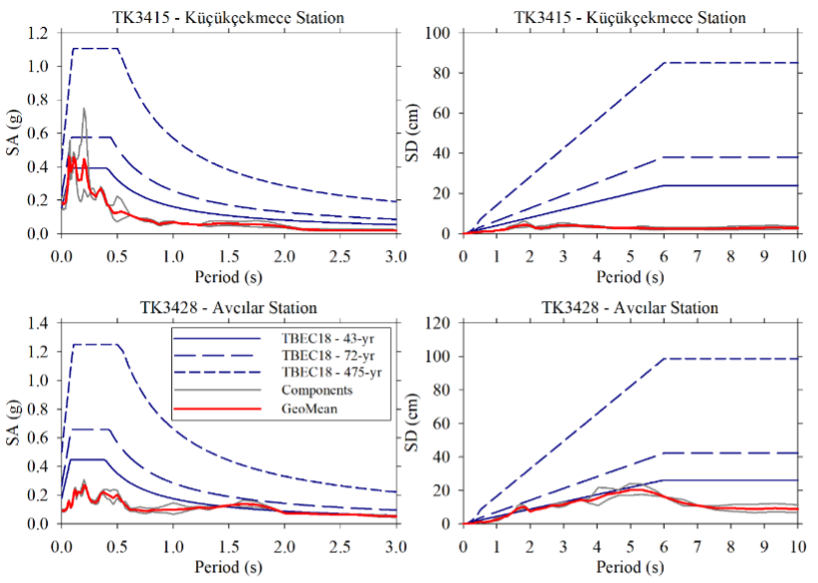
In this section, we compare code-based response spectra calculated according to the Turkish Seismic Hazard Map (Akkar et al., 2018) and the Turkish Building Earthquake Code (2018; TBEC18) versus the recordings at selected critical stations. Two strong-motion stations were selected: Küçükçekmece Station, which recorded the highest peak ground acceleration value and is characterized by a VS30of 283 meters per second; and Avcılar Station, which has a VS30 of 318 meters per second and may be critical in terms of soil deposit effects. The distances of these two stations from the fault rupture are approximately 42 kilometers (26 miles) and 38 kilometers (about 24 miles), respectively.
The code-based spectra considered for comparison correspond to return periods of 43, 72, and 475 years, which respectively represent 68%, 50%, and 10% probabilities of exceedances in 50 years. Figure 18 presents the comparisons in terms of both spectral acceleration and displacement. In addition to the two horizontal components of the recorded motions, their geometric mean spectrum is also plotted. The comparisons show that, accounting for earthquake magnitude, the recorded amplitudes are generally below the code-based spectra. At the Küçükçekmece station, short-period acceleration values slightly exceed the 43-year uniform hazard response spectrum, whereas at the Avcılar station, they are significantly lower (left panel of Figure 18) up to a period of 1.2 seconds, approximately. Regarding spectral displacements, the overall behavior at the Avcılar station aligns with the 43-year uniform hazard response spectrum up to about 5 seconds. Notably, site amplification effects are observed between 1 and 2 seconds in the Avcılar station spectra, which is consistent with the soil deposit conditions at the site (bottom row of Figure 18).
We also explore the geometric mean of recorded versus code-based peak ground acceleration and peak ground velocity. For all stations, the recorded peak ground acceleration and peak ground velocity values are lower than the code-based values at the 43-year return period level according to the Turkish Seismic Hazard Map (Figure 19).
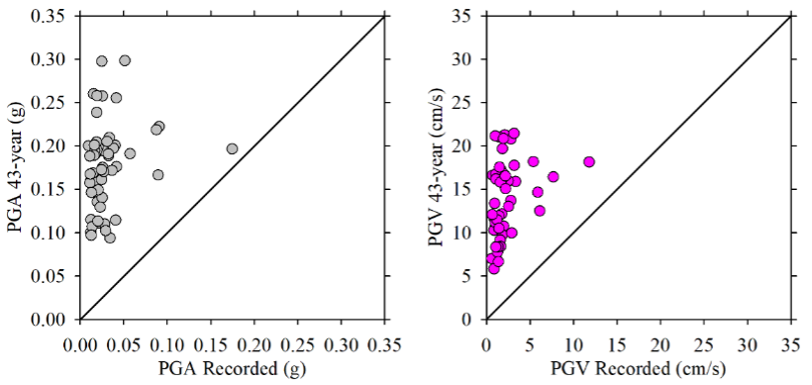
Overall, we conclude that the recorded ground motions during the April 2025 mainshock were significantly lower than the service-level (72-year return period) earthquake spectra defined in the building code (Figure 18).
Structural Damage and Casualties
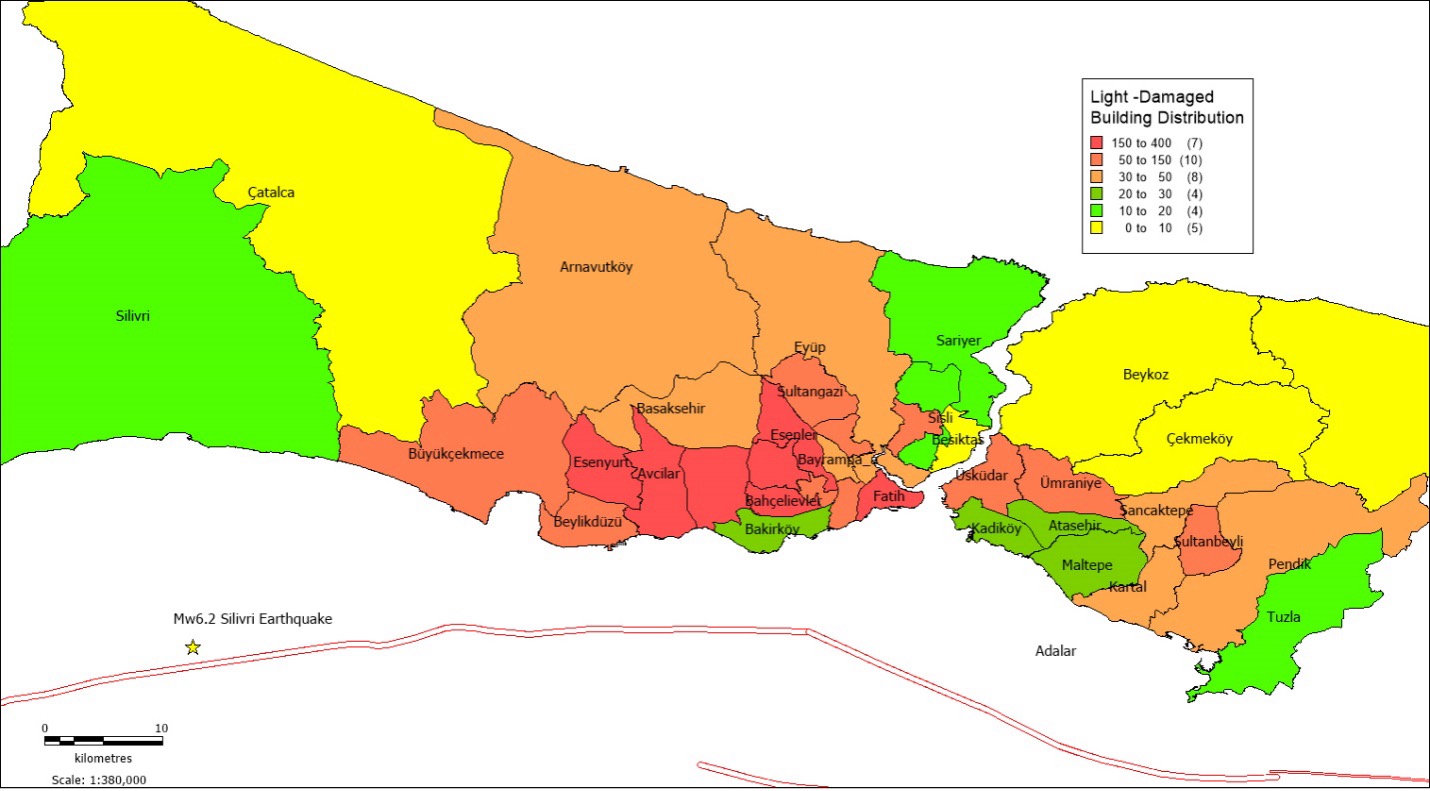
The maximum instrumentally recorded MMI level from the magnitude 6.2 earthquake is MMI VI (Figure 17). As per Figure 9, about 10% of buildings in the MMI VI zone would be expected to receive light damage (Figure 20). This is what we observed; the impact of the earthquake resulted only in light and limited damage, with no loss of life.
The 112 Emergency Call Center received approximately 1,000 calls requesting emergency assistance in the aftermath of the earthquake. Around 100,000 citizens spent the night in temporary shelters — mainly parks, schools, and mosques — due to fears of a larger earthquake following the magnitude 6.2 event.
Citizens across the affected region reported damage to 3,364 housing units. Damage assessment teams were quickly mobilized. Although citizens reported about 30,000 alarming conditions, damage assessment teams evaluated nearly 4,000 lightly damage buildings (Figure 20).
No issues were found in the transportation infrastructure, although flights were temporarily suspended for safety inspections. With the exceptions of one hospital already scheduled for demolition and another with light damage, inspections revealed no damage to healthcare facilities. Eight hospitals are base-isolated. School buildings fared similarly; damage was reported in only four schools, and these were housed in historical buildings.
A total of 236 people were injured due to panic-related incidents in the affected provinces, with five remaining hospitalized as of May 5, 2025.
The Turkish Catastrophe Insurance Pool (TCIP), known locally as DASK (Doğal Afet Sigortaları Kurumu), administers Türkiye’s Compulsory Earthquake Insurance system. Established in 2000 following the devastating 1999 Izmit earthquake, TCIP aims to provide financial protection for homeowners against earthquake-related damage and to reduce the state’s financial burden in the aftermath of such disasters. In the Istanbul Province, TCIP has an insurance penetration of 63% (2.6 million policies). As a result of this earthquake, about 15,000 claims and about USD 7 million in damage-related payments have been estimated (private communication with Ms. Serpil Günal, Secretary General, TCIP).
Conclusions and Suggestions
The April 23, 2025 magnitude 6.2 earthquake has once again highlighted the persistent seismic hazard Turkey is facing, with particular relevance to the greater Istanbul region. As expected, the event was followed by a sequence of aftershocks. The mainshock may have induced localized stress redistributions along adjacent fault segments, potentially modifying short-term rupture probabilities on sections of the North Anatolian fault system. Nevertheless, the long-term hazard associated with a future, anticipated high-magnitude “Marmara Earthquake” remains effectively unchanged.
All seismic monitoring and mitigation systems performed within expected operational parameters. This includes the Istanbul Earthquake Rapid Response and Early Warning System (IERREWS) and the Istanbul Natural Gas Network (IGRAS) automated earthquake shutoff system, both of which activated and functioned as designed.
Enhanced public education on post-earthquake behavior remains a critical component of seismic risk mitigation. From an engineering systems perspective, non-structural risks — including those arising from traffic congestion — must be addressed. Public outreach should emphasize avoiding panic-induced actions and refraining from the use of private vehicles; this will preserve emergency access and egress routes.
All municipal lifelines and infrastructure systems remained operational after the event, with the sole exception of partial mobile telecommunications service interruptions. This highlights the relative robustness of critical infrastructure, but also points to vulnerabilities in communication networks that warrant further analysis and reinforcement.
A primary engineering challenge continues to be the seismic risk posed by the existing building stock, particularly structures constructed before the implementation of modern seismic design codes. In Istanbul and other high-density urban zones, many buildings exhibit non-compliance with current Turkish Earthquake Resistant Design Code provisions.
A performance-based assessment and prioritization framework is essential: identifying high-risk structures through detailed vulnerability assessments, ranking them based on structural performance metrics, and implementing staged retrofitting strategies beginning with the most critical cases. This latest seismic event must be recognized as a call to action for structural engineers, urban planners, and regulatory authorities. Proactive risk reduction through engineering intervention is both urgent and non-negotiable.
Science Editor: Dr. Alka Tripathy-Lang, Ph.D.
Reviewer: Dr. Alexandra Tsioulou, Ph.D.
References
Akkar, S., Azak, T., Can, T.O, Çeken, U., Demircioğlu Tümsa, M.B., Duman, T.Y., Erdik, M., Ergintav, S.E., Kadirioğlu, F.T., Kalafat, D. and Kale, Ö., 2018. Evolution of seismic hazard maps in Turkey. Bulletin of Earthquake Engineering, 16(8), pp.3197-3228.
Altunel, E., Meghraoui, M., Akyüz, H.S. and Dikbas, A., 2004. Characteristics of the 1912 co‐seismic rupture along the North Anatolian fault zone (Turkey): Implications for the expected Marmara earthquake. Terra Nova, 16(4), pp.198-204.
Ambraseys, N., 2002. The seismic activity of the Marmara Sea region over the last 2000 years. Bulletin of the Seismological Society of America, 92(1), pp.1-18.
Aochi, H. and Ulrich, T., 2015. A probable earthquake scenario near Istanbul determined from dynamic simulations. Bulletin of the Seismological Society of America, 105(3), pp.1468-1475.
Armijo, R., Pondard, N., Meyer, B., Uçarkus, G., de Lépinay, B.M., Malavieille, J., Dominguez, S., Gustcher, M.A., Schmidt, S., Beck, C. and Cagatay, N., 2005. Submarine fault scarps in the Sea of Marmara pull‐apart (North Anatolian Fault): Implications for seismic hazard in Istanbul. Geochemistry, Geophysics, Geosystems, 6(6).
ASCE/SEI 7–16, 2017, June. Minimum design loads and associated criteria for buildings and other structures. American Society of Civil Engineers.
Barka, A., Akyuz, H.S., Altunel, E.R., Sunal, G., Cakir, Z., Dikbas, A.Y., Yerli, B., Armijo, R., Meyer, B., De Chabalier, J.B. and Rockwell, T., 2002. The surface rupture and slip distribution of the 17 August 1999 Izmit earthquake (M 7.4), North Anatolian fault. Bulletin of the Seismological Society of America, 92(1), pp.43-60.
Boğaziçi Üniversitesi (2025), 23 Nisan 2025 (12:49) Silivri Açıkları-İstanbul Depremi İstanbul Deprem Hızlı Müdahale Sistemi Deprem Yer Hareketi Parametreleri ve Bina Hasar Dağılımlarına Ait İlksel Tahminler, (in Turkish)
Bohnhoff, M., Martínez-Garzón, P., Bulut, F., Stierle, E. and Ben-Zion, Y., 2016. Maximum earthquake magnitudes along different sections of the North Anatolian fault zone. Tectonophysics, 674, pp.147-165.
Bouchon, M., Karabulut, H., Aktar, M., Özalaybey, S., Schmittbuhl, J. and Bouin, M.P., 2011. Extended nucleation of the 1999 M w 7.6 Izmit earthquake. Science, 331(6019), pp.877-880.
Chiou, B.S.J. and Youngs, R.R., 2014. Update of the Chiou and Youngs NGA model for the average horizontal component of peak ground motion and response spectra. Earthquake Spectra, 30(3), pp.1117-1153.
Emre, Ö., Duman, T.Y., Özalp, S., Elmacı, H., Olgun, Ş. ve Şaroğlu, F., 2013. Açıklamalı Türkiye Diri Fay Haritası, Maden Tetkik ve Arama Genel Müdürlüğü Özel Yayın Serisi-30. Ankara-Türkiye.
Erdik, M., Fahjan, Y., Ozel, O., Alcik, H., Mert, A. and Gul, M., 2003. Istanbul earthquake rapid response and the early warning system. Bulletin of earthquake engineering, 1(1), pp.157-163.
Grünthal, G. and Wahlström, R., 2012. The European-Mediterranean earthquake catalogue (EMEC) for the last millennium. Journal of seismology, 16(3), pp.535-570.
IBB. 2009, 2018. İstanbul İli Olası Deprem Kayıp Tahminlerinin Güncellenmesi Projesi, Boğaziçi Üniversitesi-Kandilli Rasathanesi ve Deprem Araştırma Enstitüsü (in Turkish)
Kaklamanos, J., Baise, L.G. and Boore, D.M., 2011. Estimating unknown input parameters when implementing the NGA ground-motion prediction equations in engineering practice. Earthquake Spectra, 27(4), pp.1219-1235.
Kale, Ö., Akkar, S., Ansari, A. and Hamzehloo, H., 2015. A ground‐motion predictive model for Iran and Turkey for horizontal PGA, PGV, and 5% damped response spectrum: Investigation of possible regional effects. Bulletin of the Seismological Society of America, 105(2A), pp.963-980.
Kotha, S.R., Weatherill, G., Bindi, D. and Cotton, F., 2022. Near-source magnitude scaling of spectral accelerations: analysis and update of Kotha et al.(2020) model. Bulletin of Earthquake Engineering, 20(3), pp.1343-1370.
Kozacı, Ö. and Altunel, E., 2022. Characteristics of the North Anatolian Fault at the eastern end of Marmara seismic gap based on multidisciplinary field evidence. Geophysical Journal International, 229(3), pp.1785-1803.
Leonard, M., 2014. Self‐consistent earthquake fault‐scaling relations: Update and extension to stable continental strike‐slip faults. Bulletin of the Seismological Society of America, 104(6), pp.2953-2965.
McHugh, C.M., Seeber, L., Cormier, M.H., Dutton, J., Cagatay, N., Polonia, A., Ryan, W.B. and Gorur, N., 2006. Submarine earthquake geology along the North Anatolia Fault in the Marmara Sea, Turkey: a model for transform basin sedimentation. Earth and Planetary Science Letters, 248(3-4), pp.661-684.
Meghraoui, M., Aksoy, M.E., Akyüz, H.S., Ferry, M., Dikbaş, A. and Altunel, E., 2012. Paleoseismology of the North Anatolian Fault at Güzelköy (Ganos segment, Turkey): Size and recurrence time of earthquake ruptures west of the Sea of Marmara. Geochemistry, Geophysics, Geosystems, 13(4).
Murru, M., Akinci, A., Falcone, G., Pucci, S., Console, R. and Parsons, T., 2016. M≥ 7 earthquake rupture forecast and time‐dependent probability for the Sea of Marmara region, Turkey. Journal of Geophysical Research: Solid Earth, 121(4), pp.2679-2707.
Oglesby, D.D. and Mai, P.M., 2012. Fault geometry, rupture dynamics and ground motion from potential earthquakes on the North Anatolian Fault under the Sea of Marmara. Geophysical Journal International, 188(3), pp.1071-1087.
Parsons, T., 2004. Recalculated probability of M≥ 7 earthquakes beneath the Sea of Marmara, Turkey. Journal of Geophysical Research: Solid Earth, 109(B5).
Parsons, T., Toda, S., Stein, R.S., Barka, A. and Dieterich, J.H., 2000. Heightened odds of large earthquakes near Istanbul: an interaction-based probability calculation. Science, 288(5466), pp.661-665.
Pondard, N., Armijo, R., King, G.C., Meyer, B. and Flerit, F., 2007. Fault interactions in the Sea of Marmara pull-apart (North Anatolian Fault): earthquake clustering and propagating earthquake sequences. Geophysical Journal International, 171(3), pp.1185-1197.
Rovida, A., Antonucci, A. and Locati, M., 2022. The European preinstrumental earthquake catalogue EPICA, the 1000–1899 catalogue for the European Seismic Hazard Model 2020. Earth System Science Data Discussions, 2022, pp.1-30.
Sandıkkaya, M.A., Akkar, S., Kale, Ö. and Yenier, E., 2023. A simulation-based regional ground-motion model for Western Turkey. Bull Earthq Eng, 21, p.4705.
Şeşetyan, K., Demircioğlu Tümsa, M.B. and Akinci, A., 2019. Evaluation of the seismic hazard in the marmara region (Turkey) based on updated databases. Geosciences, 9(12), p.489.
Stein, R.S. and Sevilgen, V., 2025. A magnitude 6.2 quake strikes the Marmara Fault at site of large historic earthquakes near Istanbul, Temblor, http://doi.org/10.32858/temblor.361
Thingbaijam, K.K.S., Martin Mai, P. and Goda, K., 2017. New empirical earthquake source‐scaling laws. Bulletin of the Seismological Society of America, 107(5), pp.2225-2246.
T-Rupt (2025), 23 Nisan 2025 M6.2 Marmara Denizi Depremi Bilgilendirme Metni (in Turkish)
Turkish Building Earthquake Code (TBEC), 2018. Ministry of Interior, Disaster and Emergency Management Presidency (AFAD), Ankara, Turkey.
Uçarkuş, G., Cakir, Z. and Armijo, R., 2011. Western termination of the Mw 7.4, 1999 Izmit earthquake rupture: implications for the expected large earthquake in the Sea of Marmara. Turkish Journal of Earth Sciences, 20(4), pp.379-394.
Wells, D.L. and Coppersmith, K.J., 1994. New empirical relationships among magnitude, rupture length, rupture width, rupture area, and surface displacement. Bulletin of the seismological Society of America, 84(4), pp.974-1002.
Yamamoto, Y., Kalafat, D., Pinar, A., Takahashi, N., Coskun, Z., Polat, R., Kaneda, Y. and Ozener, H., 2020. Fault geometry beneath the western and Central Marmara Sea, Turkey, based on ocean bottom seismographic observations: Implications for future large earthquakes. Tectonophysics, 791, p.228568.
Yamamoto, Y., Kalafat, D., Pinar, A., Takahashi, N., Polat, R., Kaneda, Y. and Ozener, H., 2022. Seismic velocity structure along the North Anatolian Fault beneath the Central Marmara Sea and its implication for seismogenesis. Geophysical Journal International, 228(1), pp.396-411.
Zulfikar, C., Erdik, M., Safak, E., Biyikoglu, H. and Kariptas, C., 2016. Istanbul natural gas network rapid response and risk mitigation system. Bulletin of Earthquake Engineering, 14(9), pp.2565-2578.
Copyright
Text © 2025 Temblor. CC BY-NC-ND 4.0
We publish our work — articles and maps made by Temblor — under a Creative Commons Attribution-NonCommercial-NoDerivatives 4.0 International (CC BY-NC-ND 4.0) license.
For more information, please see our Republishing Guidelines or reach out to news@temblor.net with any questions.