
A large foreshock that struck 10 days before the magnitude 8.8 Kamchatka earthquake brought the epicentral megathrust patch closer to failure and produced an exceptionally abundant burst of aftershocks.
By Ross S. Stein (Temblor, Inc.), Shinji Toda (Tōhoku University), Gabriel Lotto (Temblor, Inc.), Hector Gonzalez-Huizar (CICESE), and Volkan Sevilgen (Temblor, Inc.)
Citation: Stein, R. S., Toda, S., Lotto, G., Gonzalez-Huizar, H., and Sevilgen, V., 2025, Huge July 2025 Kamchatka earthquake followed unusually productive foreshock sequence, Temblor, http://doi.org/10.32858/temblor.366
On July 29, 2025, at 11:24 a.m. local time (2025-07-29 23:24:50, UTC), a magnitude 8.8 earthquake struck offshore Kamchatka, near the city of Petropavlovsk-Kamchatsk in Kamchatka Krai, Russia. As of this writing, no direct fatalities have been reported, but severe shaking rocked parts of the Kamchatka Peninsula, causing damage.
This high-latitude region is known for its volcanoes sheathed in snow. The volcanoes result from the subduction of the Pacific Plate beneath the western edge of the North American Plate. This section of the North American Plate is also known as the Okhotsk Plate. Here, the oceanic Pacific Plate — old, cold, and heavy — sinks beneath the more buoyant continent. This process of subduction can happen slowly and smoothly, or it can occur in sudden starts that manifest as earthquakes.
The magnitude 8.8 mainshock followed a foreshock sequence that began in 2024 with a magnitude 7.0 event. Ten days before the mainshock, on July 20, 2025, another foreshock struck – a magnitude 7.4 earthquake (Hubbard and Bradley, 2025).We explore these events via Coulomb stress transfer modeling, which indicates that the greatest stress transfer following the mainshock is to the southwest.
This mainshock — among the 10 largest earthquakes since 1900 — occurred near the northeastern edge of a very similar 1952 magnitude 8.8-9.0 shock. In fact, we have an unusual opportunity to see what could be a nearly complete earthquake cycle — the accumulation and release of stress in successive earthquakes.
When earthquakes occur under the ocean, they can trigger tsunamis. The subduction zone earthquake triggered tsunami warnings and advisories around the Pacific. We compare the earthquake’s tsunami to similar events, with a focus on the 2010 magnitude 8.8 Maule earthquake and tsunami in Chile. Why was the 2025 tsunami so much smaller, and apparently less destructive, than the 2010 tsunami?
Four days after the mainshock, Krasheninnikov volcano, which had been in repose for five centuries, erupted. This occurrence, we cannot so easily explain.
Random events or chain reaction?
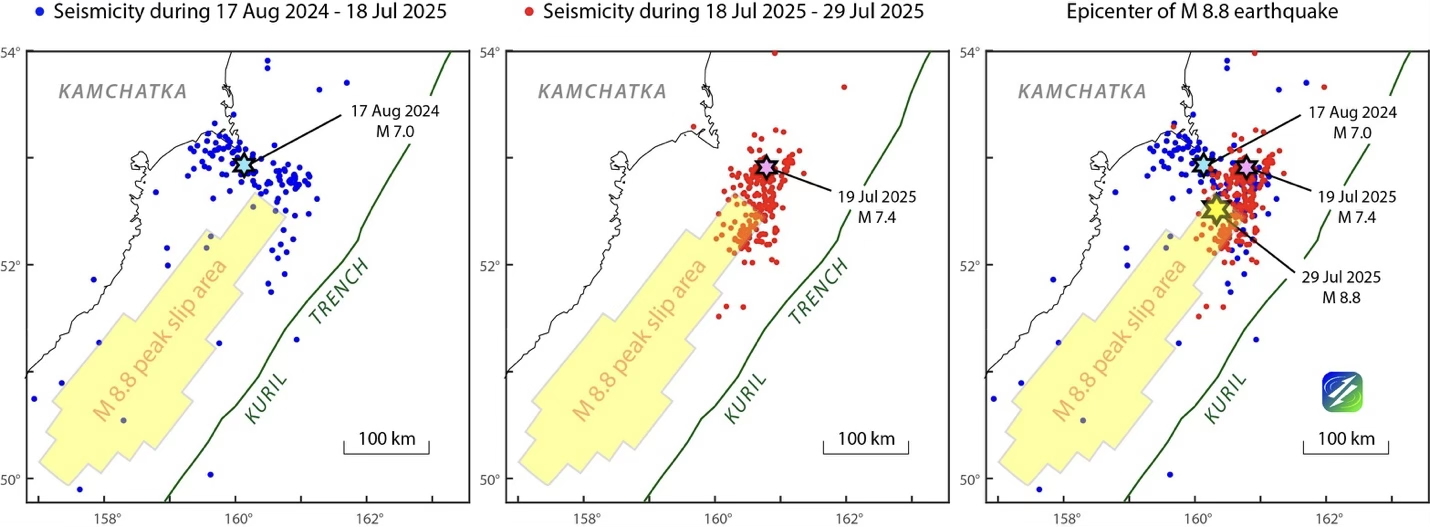
Let’s take a look at the two significant foreshocks – the 2024 magnitude 7.0 shock and the 2025 magnitude 7.4 shock – and how they may have influenced the magnitude 8.8 mainshock. The epicenters of these three events were less than 50 kilometers from each other. Did the first promote the second, and did they both promote the magnitude 8.8 event?
First, we focus on the aftershocks of the two major foreshocks (Figure 1). Aftershocks followed the August 17, 2024 magnitude 7.0 event (Figure 1, left panel). It is within the cluster of aftershocks that the July 20, 2025 magnitude 7.4 shock struck. This event caused its own aftershock cluster (Figure 1, middle panel). It is within this cluster that the July 29, 2025 magnitude 8.8 mainshock occurred (Figure 1, right panel).
The aftershock-to-future mainshock relationship suggests that these are not random events, but rather part of some kind of stress transfer process. Just as important, compare the left and middle panel: The magnitude 7.4 shock produced more aftershocks in 10 days than the magnitude 7.0 shock did in nearly a year.
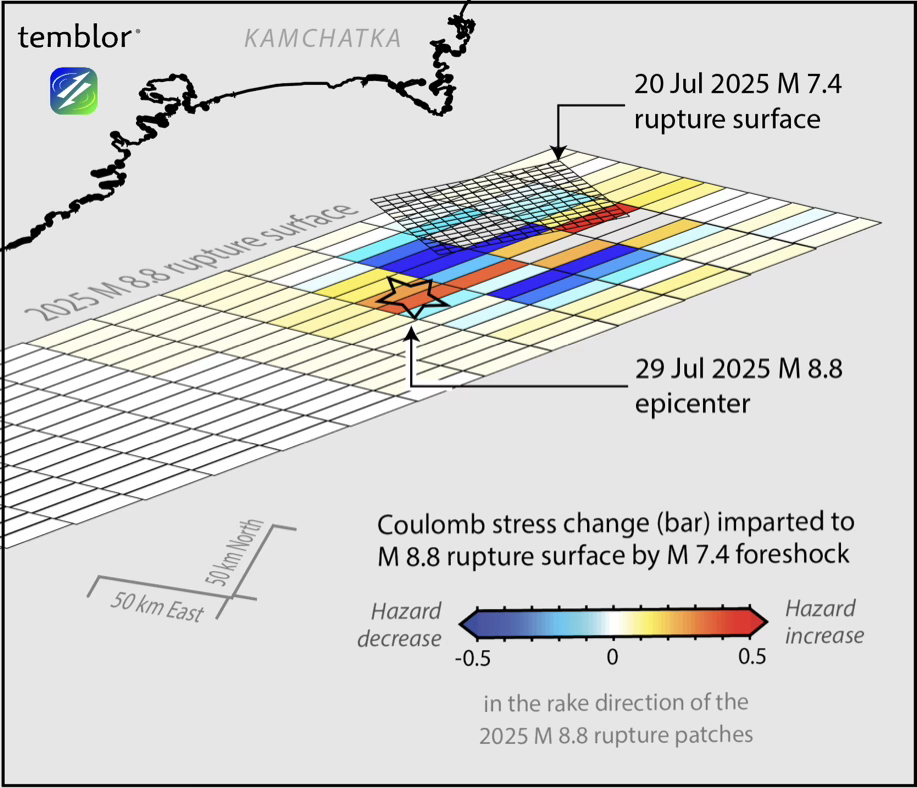
The Coulomb stress hypothesis posits that failure on a fault — most often an earthquake — is promoted when a nearby earthquake causes the shear stress on the fault to increase and the fault to unclamp; a decrease in shear stress clamps the fault and inhibits failure. (Start here in the Coulomb stress video to understand what these stresses are and why they matter.) Our calculations use Coulomb 3.4 (Toda et al., 2011) and the USGS finite fault models.
First, we find that the epicentral patch of the 2025 magnitude 7.4 foreshock rupture surface was brought about 1.5 bars closer to failure by the 2024 foreshock, although the northwest corner of the eventual magnitude 8.8 mainshock rupture surface was brought farther from failure (Figure 2). This is a very large stress change, and is often associated with a seismicity increase.

The July 20, 2025 magnitude 7.4 shock, which lies above the megathrust interface, brought portions of the interface closer to failure (the red patches in Figure 3) and further from failure (the blue patches in Figure 3). The epicenter of the July 29 magnitude 8.8 mainshock appears to lie in a lobe brought about 0.5 bar closer to failure – a significant amount.
So, we find that each successive shock greater than or equal to magnitude 7.0 brought the next epicentral patch closer to failure — comparable to a chain reaction. But, although there appears to be a stress transfer relationship in the foreshock sequence, we cannot use this insight alone to develop precursory insight for great earthquakes. The reason, as illuminated by Bradley and Hubbard (2025) in their analysis of this earthquake sequence, is that while about half of the magnitude 8.5 and greater shocks are preceded within a year by foreshocks, only 1% of shocks of magnitude 7.0 and greater are followed by massive magnitude 8.5 or greater shocks. So, the vast majority of shocks of magnitude 7.0 or greater do not portend a future great shock.
Was the 10-day foreshock unique?
Mainshock-aftershock sequences follow an empirical relationship called Omori’s Law, which describes how the frequency of aftershocks decays with time. This decay is captured by the Omori ‘p’ exponent. For p =1, the number of quakes in the first day is the same as in the next 10 days, and is the same again as in the next 100 days, etc. The abundance or productivity of aftershocks is defined by the Omori ‘k’ parameter. A sequence with k=10 produces 10 times the number of aftershocks than if k=1.The larger the mainshock, the higher the k value, but with a very large range.
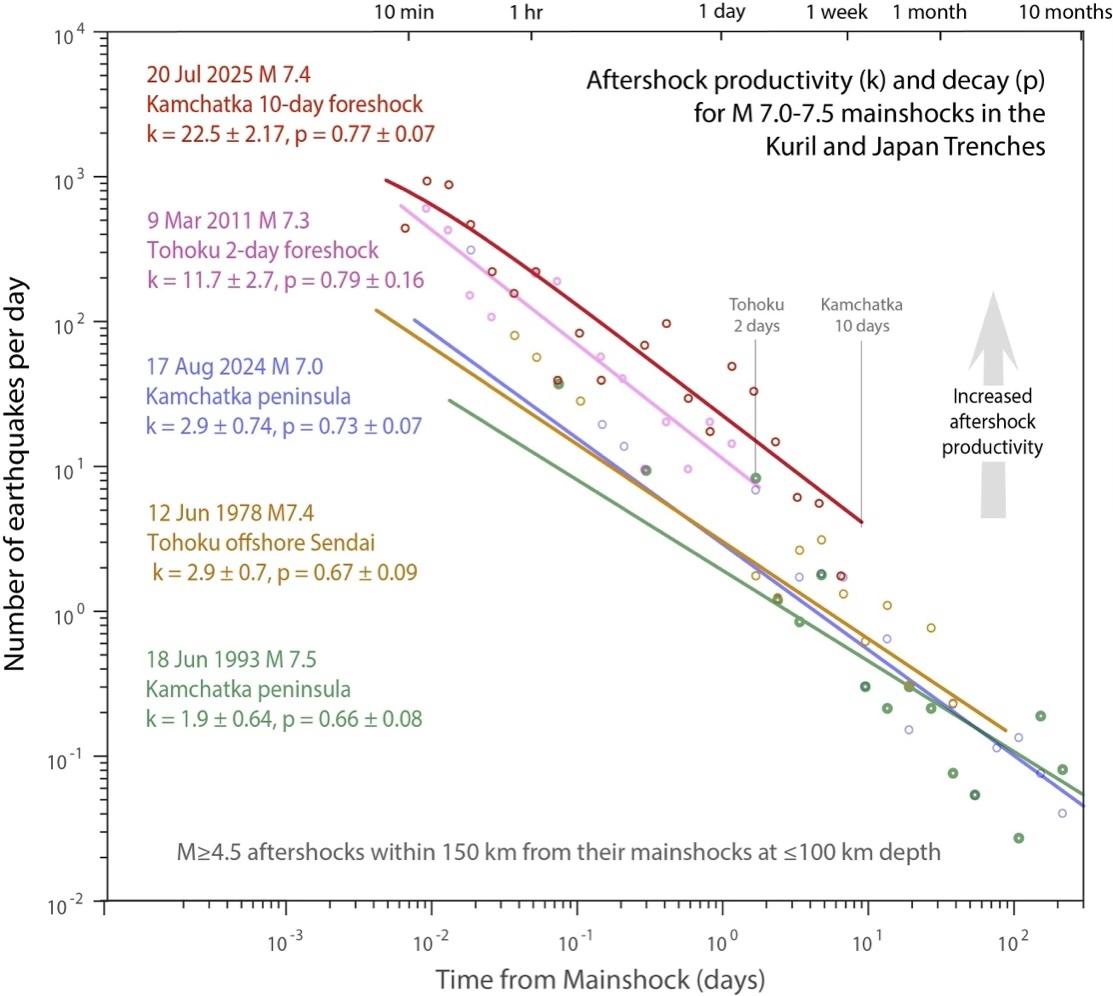
When we compare the two Kamchatka foreshocks from the Kuril Trench to similarly sized shocks in the Japan Trench, we see that the 10-day Kamchatka foreshock and the 2-day Tohoku foreshock (Marsan and Enescu, 2012) have unusually high aftershock abundances. The Kamchatka aftershock rate (red line, Figure 4) is about 10 times higher than the 1-year Kamchatka foreshock (purple line) or a 1993 magnitude 7.5 Kamchatka earthquake (green line). In contrast, the decay rates (the Omori p exponent, or the negative slope of the lines) do not strongly distinguish the 2- or 10-day foreshocks from other events. We note that Liu et al. (2019) found that the aftershock productivity of a magnitude 6.5 foreshock that struck 34 hours before the magnitude 7.1 Ridgecrest, California earthquake was 8.5 times higher than the mean for its magnitude.
Dascher-Cousineau et al. (2020) found that the abundance of nearby stressed faults (which we refer to as ‘receivers’ of stress) controls the aftershock productivity for a given mainshock (which we refer to as the ‘sources’ of stress), rather than the mainshock stress drop or other rupture properties. Following this reasoning, we infer that the unusual productivity of the 2025 magnitude 7.4 foreshock results from a highly stressed subduction zone rather than properties intrinsic to the magnitude 7.4 foreshock itself. Aftershock productivity decreases with mainshock magnitude, so the magnitude 7.0 event would not be expected to match the aftershock rate of the magnitude 7.4. This analysis also suggests that even though the 1-year foreshock increased the stress in the region, setting the stage for the 10-day foreshock and mainshock, it was not highly productive, indicating that it was likely not a precursor.
Could unusually high aftershock productivity be a clue to an enhanced probability of triggering a larger quake? Dascher-Cousineau et al. (2020) found that a typical magnitude 7.4 shock should, on average, produce about 24 aftershocks in 10 days within about a 140 kilometer radius from its epicenter. We found 138 aftershocks in the 9.7 days following the July 20, 2025 magnitude 7.4 foreshock — 6 times higher than the mean. Statistically, each aftershock has a small chance of triggering a much larger mainshock, so the greater the number of aftershocks, the greater this likelihood. This greater likelihood will tend to be captured by the aftershock forecasts issued by the USGS for some mainshocks, which projects their early aftershock productivity in time (Hardebeck et al., 2024).
So, the Kamchatka and Tohoku productivity results (and we could include Ridgecrest, too, per Liu et al., 2019) are tantalizing but not conclusive; in our judgment, what is needed now is to examine all foreshocks of earthquakes of magnitude 8.5 or greater to see if these show productivity that is much higher than average for subduction zone shocks.
Did we observe a complete earthquake cycle?
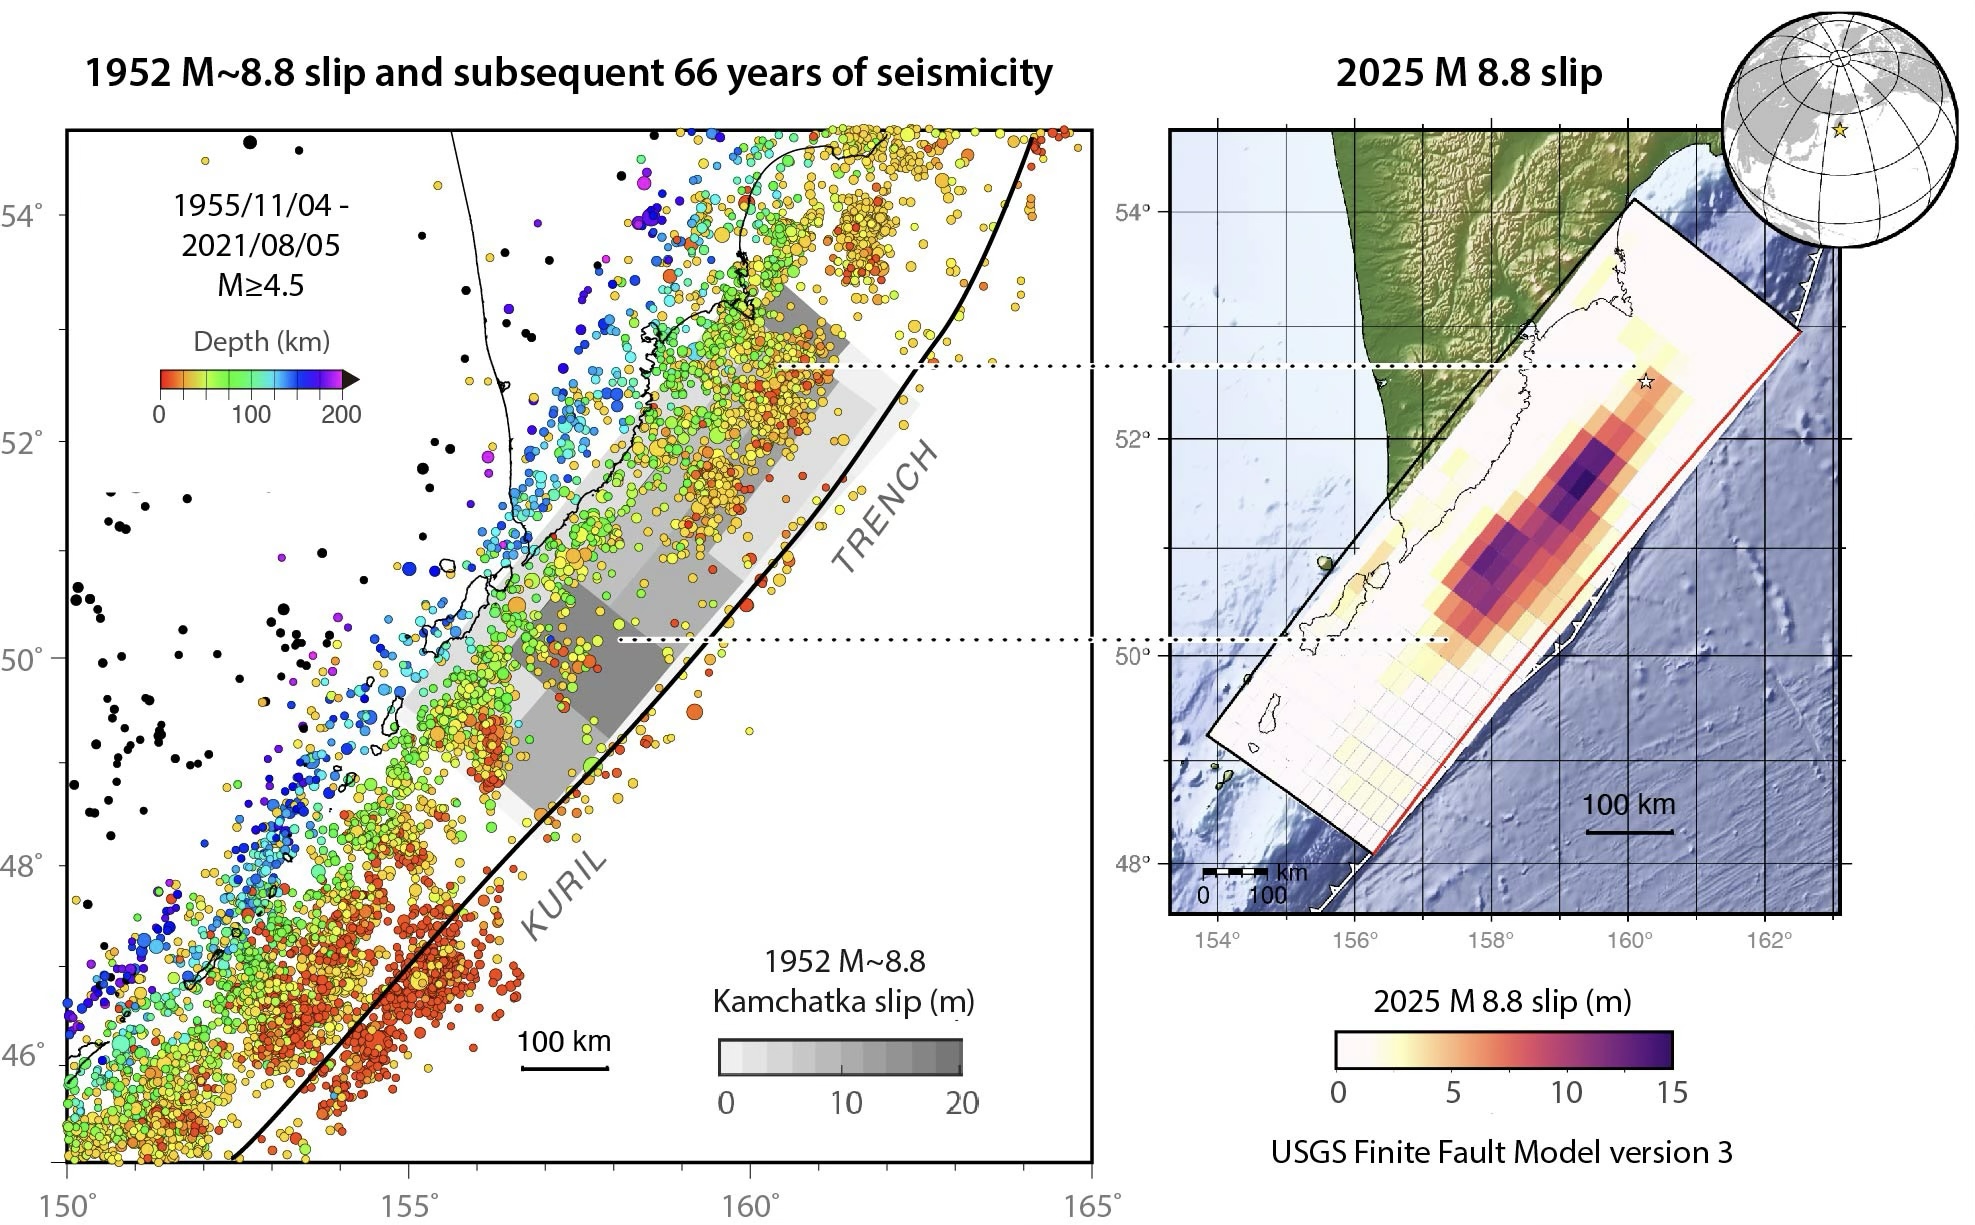
As best we can tell, the 1952 and 2025 shocks are very similar in magnitude and location; at minimum, their high slip areas overlap, and they have adjacent epicenters (Figure 5). The major difference between the two is that the 1952 rupture appears to extend a few hundred kilometers farther to the southwest. If so, the 2025 quake is not an exact repeat of 1952. However, our understanding of the 1952 earthquake’s slip is based on modeling of the near-field tsunami deposits and historical records (MacInnes et al., 2010), whereas the 2025 slip is based on teleseismic broadband waveforms, long period surface waves, and InSAR (radar) displacement observations from Sentinel-1 (USGS, 2025). So, these slip models are not strictly comparable.
If we consider these earthquakes to be very similar, can we regard their intervening 73 years as representing a full earthquake cycle? If true, we would have observed the accumulation and release of stress in a subduction zone environment.
The plate subduction velocity at the Kuril Trench is 69 millimeters per year, and the trench is migrating in the opposite direction (away from Kamchatka) at 28 millimeters per year (Schellart et al., 2011). The combined megathrust slip rate is 97 millimeters per year. Thus, during the 73 years between the 1952 and 2025 mainshocks, 7 meters of slip would have accumulated. The mean slip for the 2025 mainshock over its 400 by 50 kilometer rupture area, estimated from the USGS finite fault model, is also about 7 meters (Figure 5). So, the net deficit in slip would have been removed when the 2025 shock struck. This suggests that we may have observed a complete earthquake cycle.
However, if we use the DeMets et al. (2010) subduction rate of 67 millimeters per year, and focus on the peak slip of about 9 meters in both events assuming full coupling of both plates, then 73 years would be only about half of the earthquake cycle. If true, why would the 2025 quake have struck so prematurely?
So, the comparison between these two events is approximate, and with the present information, we do not know whether we have observed a complete earthquake cycle or only part of one. Nevertheless, this is a valuable dataset because full earthquake cycles are generally much longer, depriving us of an instrumental record.
Was a seismicity hole filled?
Now, let’s take a closer look at the 2025 rupture with respect to seismicity since the 1952 quake (Figure 6). One sees that the intervening shocks greater than or equal to magnitude 7.0 either lie along the down-dip (northwest) edge of the future 2025 rupture surface, or perhaps surround the future rupture. One also sees a cluster of shocks greater than or equal to magnitude 7.0 near the 1952 and 2025 epicenters, with two such shocks leading up to the 2025 magnitude 8.8 mainshock (the inset in the lower right of Figure 6 isolates that sequence). These are the previously mentioned 1-year and 10-day foreshocks.
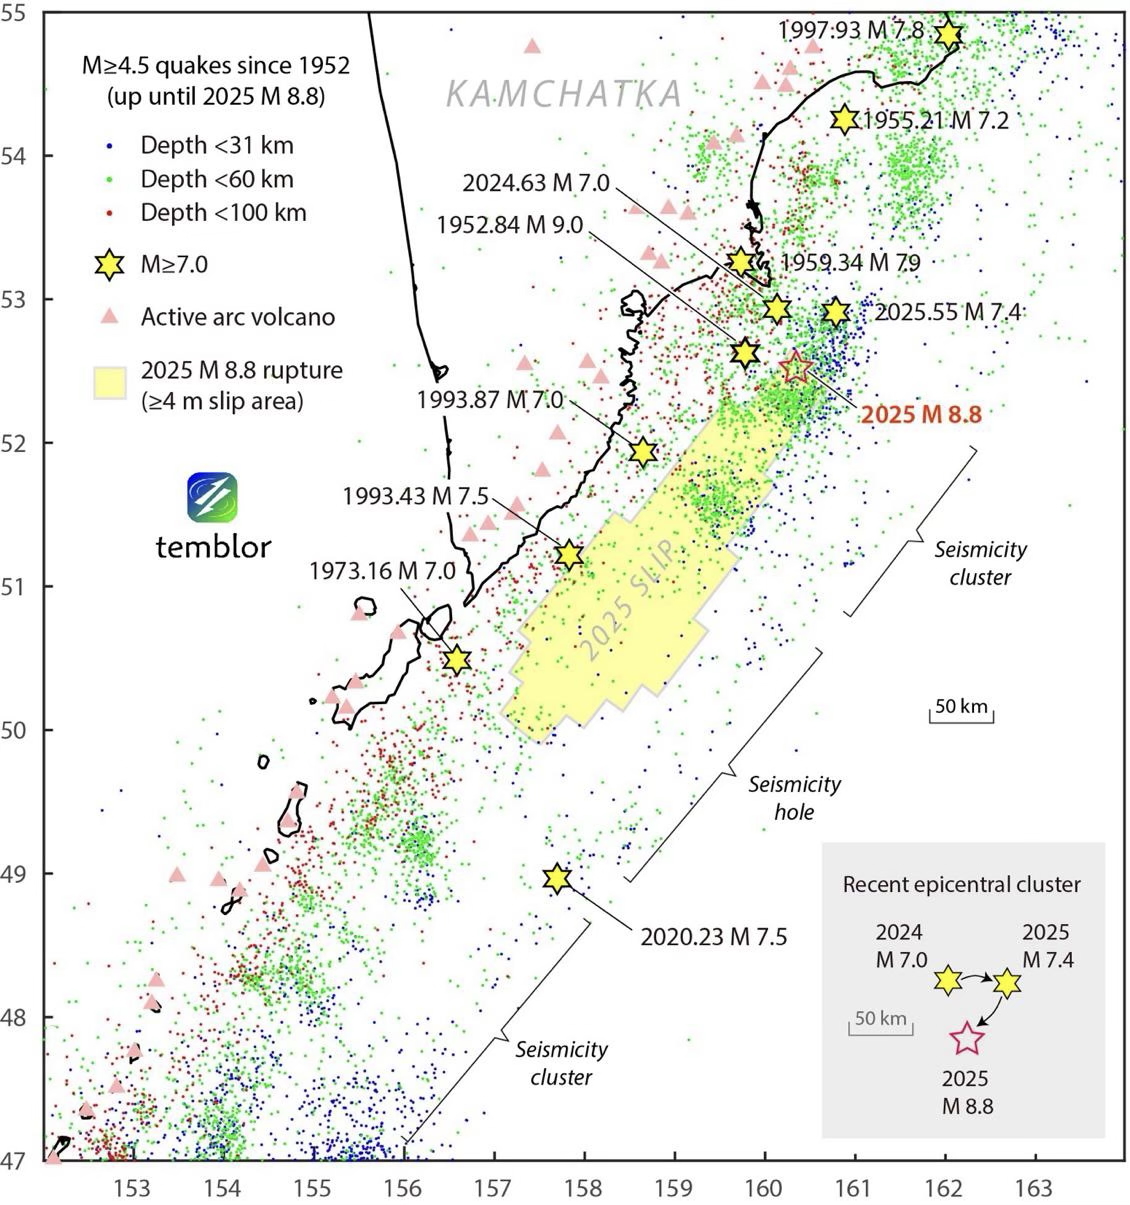
The smaller shocks in Figure B tell a different story. There are seismicity clusters in the epicentral region and well to the southwest of the 2025 slip zone; a seismicity ‘hole’ lies in about two-thirds of the high slip area of both the 1952 and 2025 shocks. Toda and Stein (2022) argued that such a hole in the high-slip area (left panel of Figure 5) typifies all subduction zone seismicity beginning a few years after a megathrust (approximately of magnitude 9 or greater) event strikes. The 2025 main shock’s slip partly fills that hole.
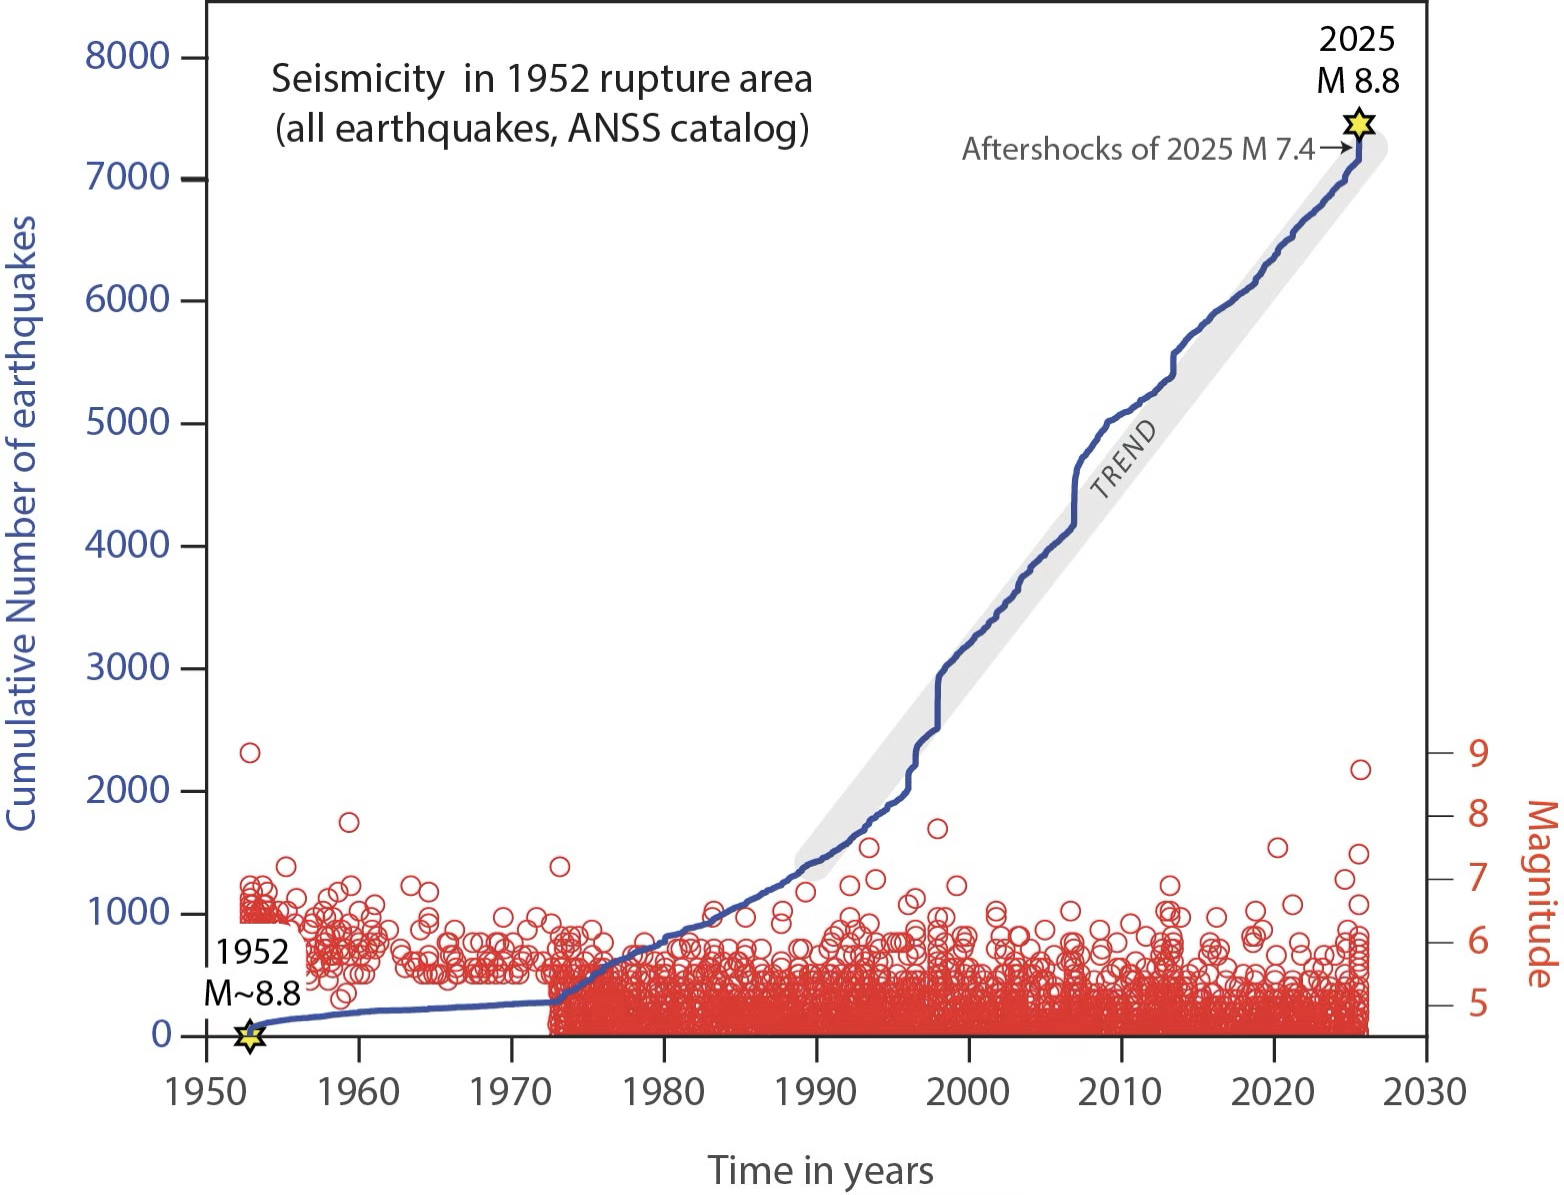
The rate of the magnitude 4.5 and greater shocks over the future rupture zone has been very steady since 1995, which is when that record becomes complete and reliable for this minimum magnitude (Figure 7). In other words, there is neither a longterm slow-down nor an acceleration of seismicity leading up to the 2025 magnitude 8.8 shock. The observation of steady seismicity rate is an important – and disappointing – result that confirms that seismicity rate here is not indicative of precursory activity, at least until the last 10 days.
Do we expect another hole?
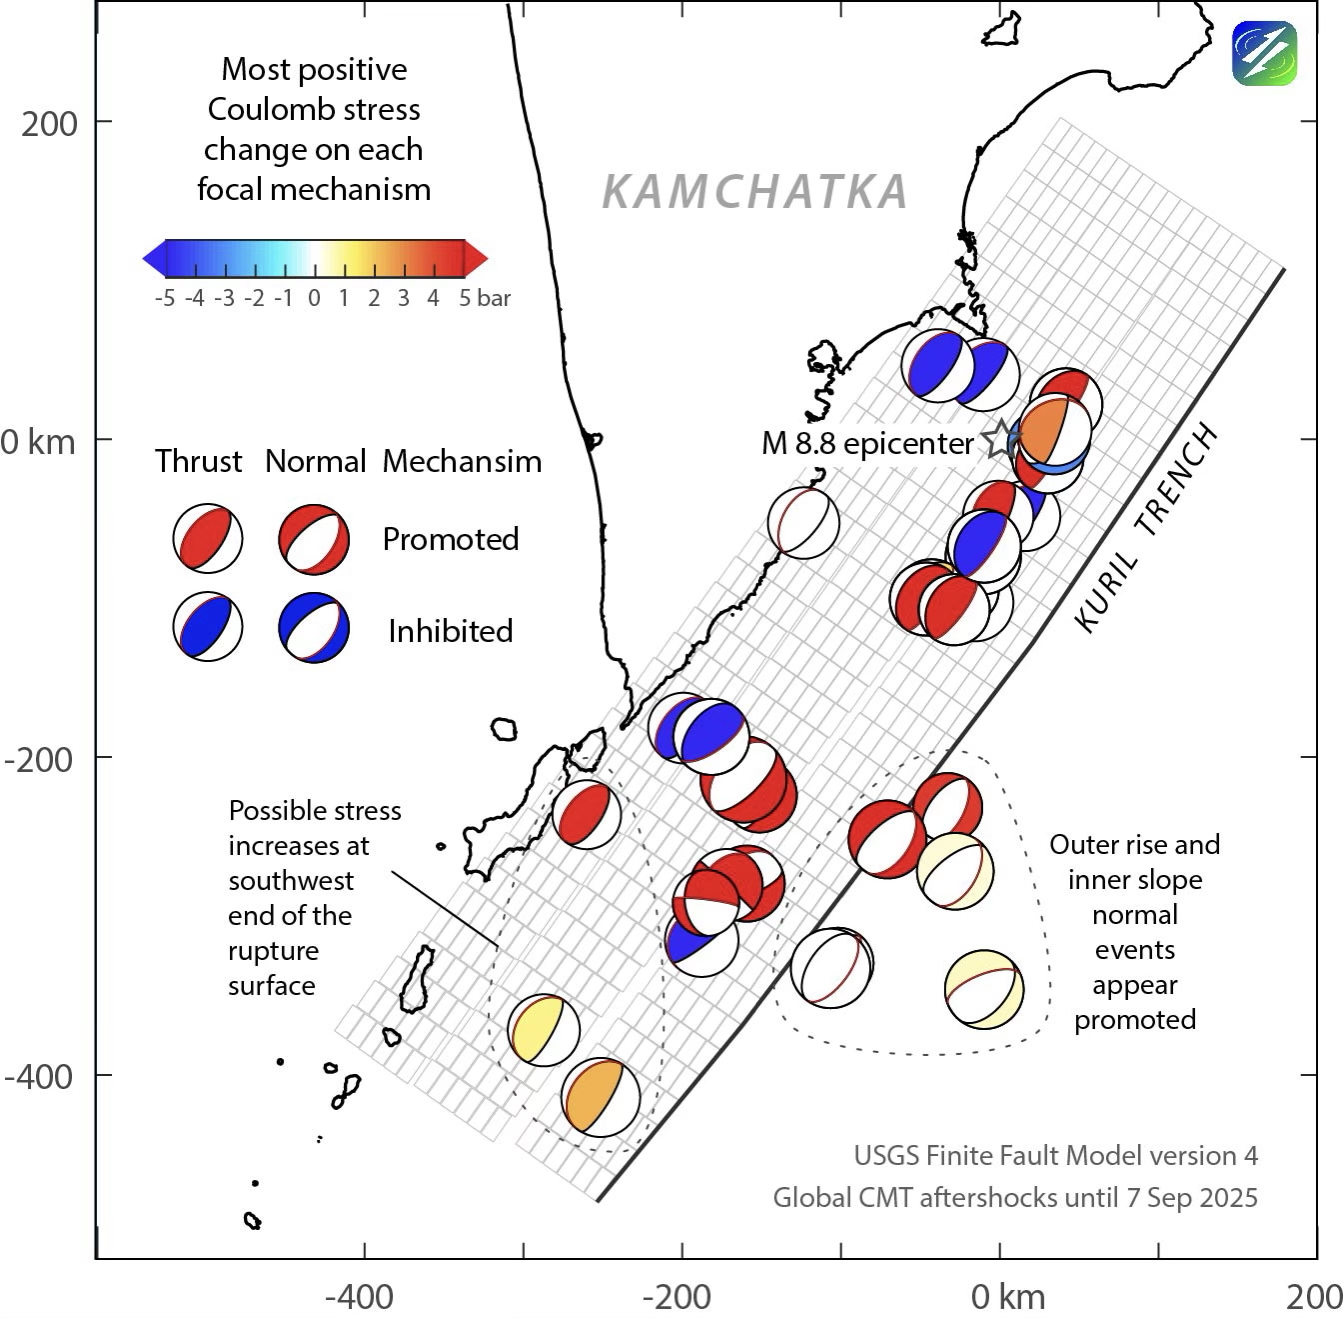
As the final step in our Coulomb stress transfer analysis, we calculated the stress imparted by the magnitude 8.8 rupture to its larger aftershocks (Figure 8). This calculation depends on the nodal planes, or two possible rupture surfaces, of each aftershock, as well as their location and depth. Because of depth uncertainties, it’s not always clear that the aftershock lies below or above the megathrust surface. Their depths alter the stress.
If the USGS rupture model, the Global CMT focal earthquakes, and the Coulomb hypothesis were all perfect, all the mechanisms (beachballs) would be red, which is far from the case here. Nevertheless, normal faulting events in the outer rise and inner slope appear to be promoted where we would expect tensional aftershocks to occur (Lin et al., 2004). There is also an indication that the megathrust southwest of the rupture — where large subduction future aftershocks might be expected — was brought closer to failure.
In contrast, most of the magnitude 8.8 rupture surface has been brought farther from failure, and so, within several years, we expect seismicity there to shut down below the preceding or background rate, as found by Toda and Stein (2022) for megathrusts of magnitude 8.8 or greater – globally – in the past 65 years.
How strong was shaking?
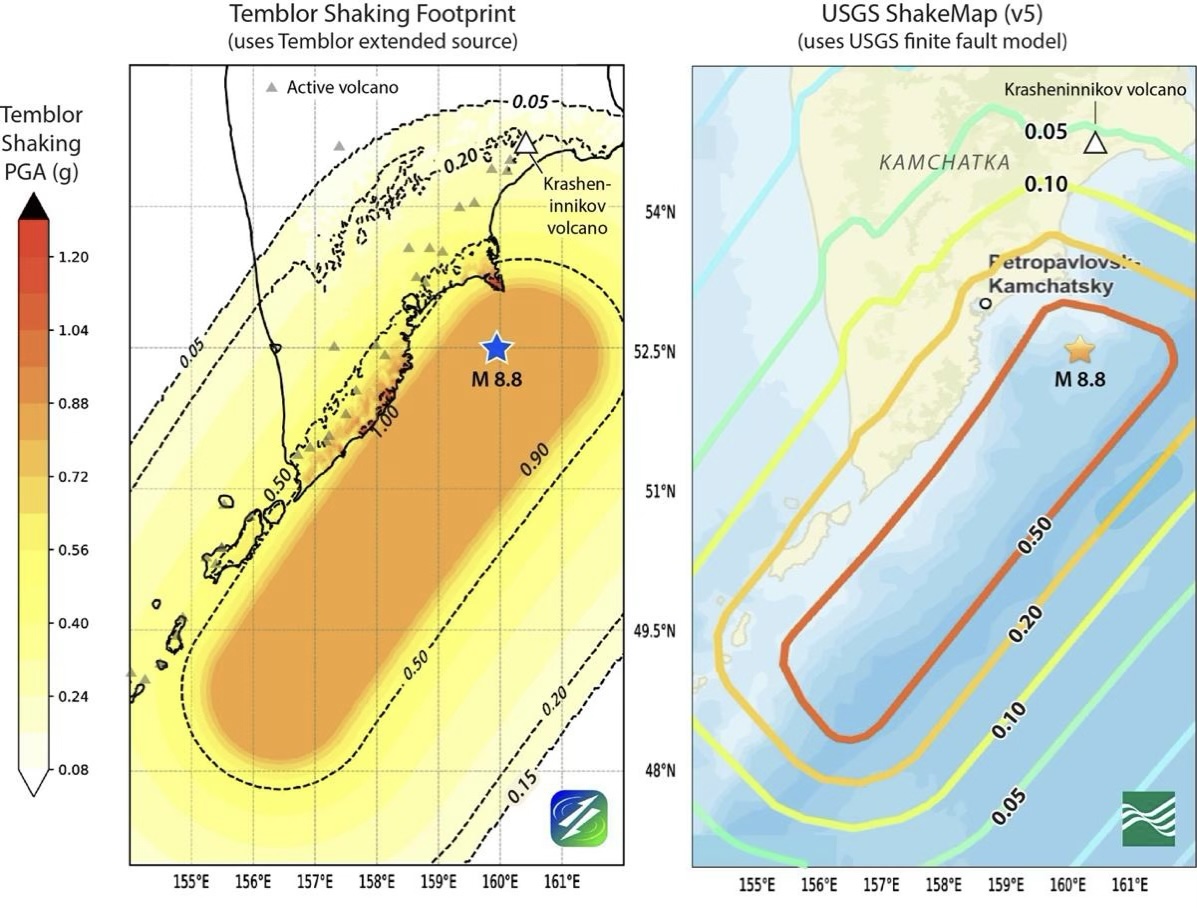
The USGS released a series of ShakeMaps, and the latest one is shown in Figure 9 at right. We at Temblor can create a model of the shaking footprint using our own source, ground motion model for subduction events, and site amplification model (Figure 9 at left). The two models of shaking resemble each other, although Temblor’s modeled shaking is about twice as high on the Kamchatka coast. To our knowledge, no strong motion recordings or damage assessments from Russia have been released, so we don’t know which model is closer to reality. There are 118 Did You Feel It? reports submitted by local residents, which the USGS interprets as indicating shaking about twice as high as its model, but these do not substitute for instrumental recordings, for which we must wait.
Why was the tsunami so modest?
After the terrible tolls exacted by the much larger tsunamis associated with the 2004 magnitude 9.2 Sumatra and 2011 magnitude 9.0 Tohoku earthquakes (the USGS determined that both quakes were of magnitude 9.0), the Kamchatka tsunami appears to have been relatively benign. However, the Kamchatka earthquake is significantly smaller in magnitude, with about fourfold less energy released than the Sumatra earthquake.
For the Kamchatka tsunami, wave heights reportedly reached up to 5 meters (16 feet) in coastal regions close to the rupture, flooding the Severo-Kurilsk port and a fish processing plant. The Russian Academy of Sciences noted isolated “splashes” up to 19 meters in the Northern Kuril Islands. Vessels were swept from moorings, and some structures were damaged or destroyed. Satellite imagery indicates damage to one of the piers at Russia’s main Rybachy Pacific nuclear submarine base. Kamchatka’s tsunami traveled throughout the Pacific basin (Figure 10), where tide gauges recorded wave heights reaching 1.7 meters in Hawaii, 1.5 meters at Midway Atoll, 1.4 meters in Japan, and 1.2 meters in Crescent City, California.
How does the 2025 tsunami compare to the tsunami generated by the 1952 Kamchatka magnitude 8.8 quake? MacInnes et al. (2010) summarized the local tsunami as follows: “Mapped deposits and local observations of the 1952 Kamchatka tsunami indicate that near-field run-up in central Kamchatka was consistently less than 10 m (averaging 6 m).” The authors note that tsunami run-ups were generally larger at the Kuril Islands but with higher variance, including a report as high as 15 meters in the town of Severo-Kurilsk. Tide gauge records from the 1952 tsunami showed 2.4 meters in Hawaii, 1.9 meters at Midway Atoll, 1-2 meters in Japan, and 0.9 meters in Crescent City, according to the NCEI/WDS Global Historical Tsunami Database. All in all, even though the 1952 tsunami may have been slightly larger near the epicenter, the overall open ocean wave heights are similar between 1952 and 2025. This is consistent with the idea that the earthquakes themselves were comparable.
Contrast the 2025 Kamchatka tsunami with the tsunami from the similar-sized 2010 magnitude 8.8 Maule, Chile shock: The maximum recorded run-up height in the Maule earthquake was 29 meters (95 feet) at Constitución, with average run-up heights typically in the 10 to 12 meter range along the Chilean coast, where 124 people died from tsunami inundation. The extent of measurable open-ocean tsunami waves was much larger for the Maule 2010 earthquake than for Kamchatka (Figure 10). Because tsunami amplitude decreases with distance (largely as a result of geometric spreading), the only reason for the difference in open-ocean tsunami wave height is that the peak tsunami amplitude at the source of the Maule earthquake was larger.
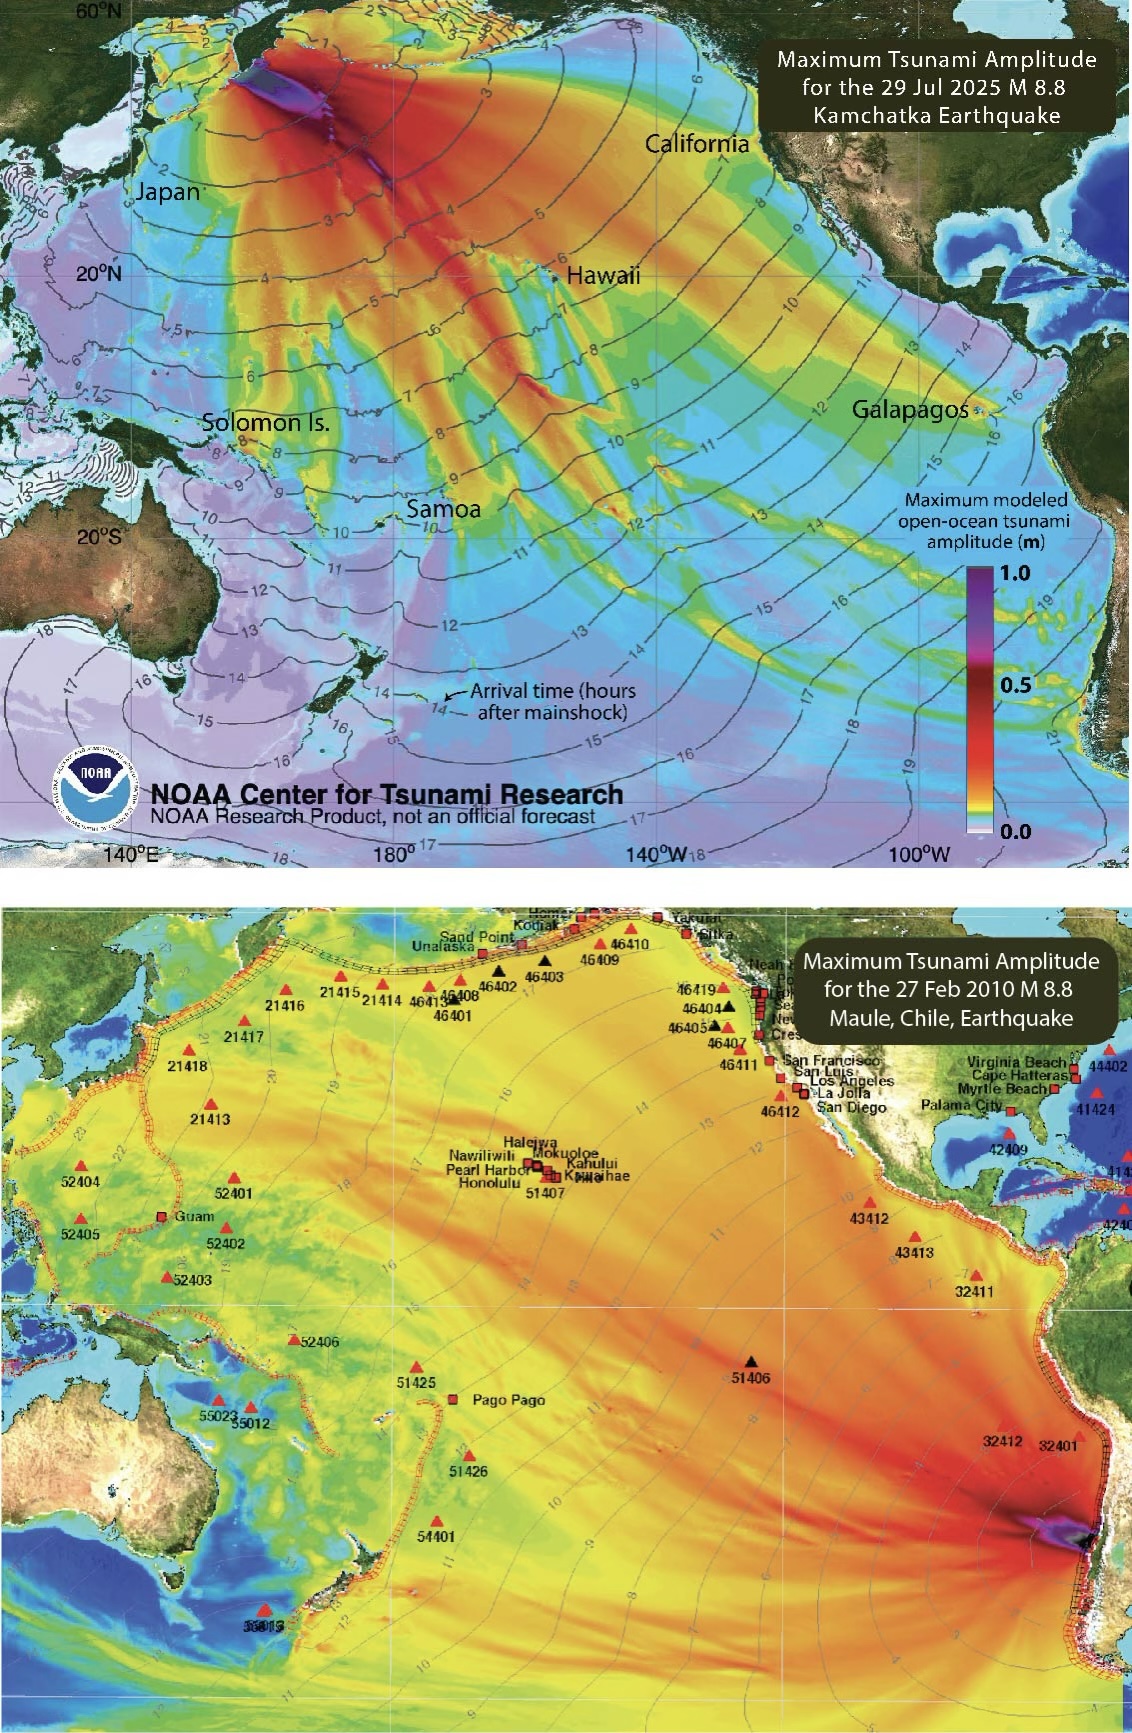
The moment tensor depth of the two quakes (the depth of the center of slip) is comparable — 22 kilometers for Maule and 30 kilometers for Kamchatka. The mean slip in the Maule and 2025 Kamchatka earthquakes is also similar at 7 to 8 meters, as is the peak slip of 14 to 16 meters. What accounts for the difference between magnitude 8.8 shocks?
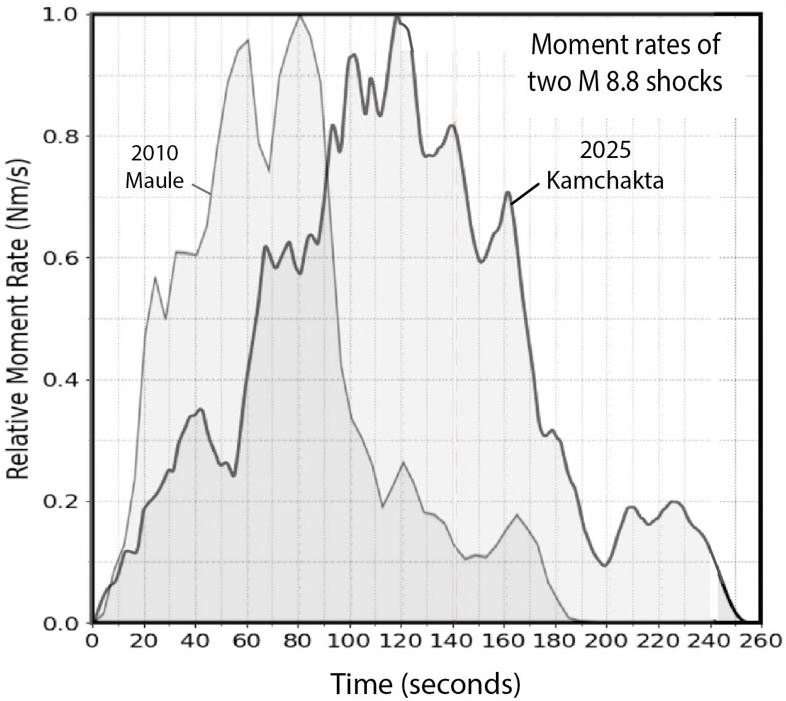
We can eliminate candidate explanations of earthquake rupture speed and duration. The speed at which an earthquake unzips is thought to roughly inversely correlate with its tsunami height: The longer the rupture duration, the larger the tsunami. The idea is that a rupture will slow down when it propagates up toward the shallow part of the subduction zone. Shallow rupture propagation means greater seafloor displacement and a higher tsunami amplitude. In Figure 11, we compare the USGS rupture time histories for the 2010 Maule and the 2025 Kamchatka events. If anything, Kamchatka took longer to unzip than Maule. The Kamchatka event peaked about 50 seconds later than Maule, and took up to 60 seconds longer to stop. Knowing nothing else about the actual events, this would predict a larger tsunami in 2025 than in 2010 — opposite to what we see.
We know that what matters most for tsunami generation is the amount that the shallow seafloor shifts during shaking (e.g., Lotto et al., 2017). For example, if the seafloor gets pushed up 5 meters, the tsunami usually starts at a height of about 5 meters before dissipating as it crosses the ocean. It is notoriously difficult to pin down how much the seafloor actually moves during an earthquake because that part of the event is farthest from most onshore instruments used to construct finite fault models.
Constraints on seafloor movement – which controls the local tsunami in particular – usually become available after years of data collection and numerical modeling studies. Only in Japan have there been ocean bottom measurements of large tsunamis to rapidly refine these models (e.g., Rabinowitz et al., 2015; Sun et al., 2017). Because we lack systematic coastal run-up measurements of the Kamchatka quake, and because future finite fault models of the earthquake might illuminate its shallow slip component, we will have to wait to answer this question.

Did the mainshock trigger Krasheninnikov’s eruption?
Four days after the mainshock, Krasheninnikov volcano awoke from five centuries of slumber with an eruption. There was no seismicity buildup or earthquakes with magnitude 4.5 or greater in the 4-day span between the mainshock and the eruption. (It is possible that smaller magnitude earthquakes increased, and this would be an avenue for future work, assuming the data are available.) Similarly, one day after the 1952 magnitude 8.8 earthquake, Karpinsky volcano erupted; one week later, the Tao-Rusyr caldera erupted explosively (Walter and Amelung, 2007). These volcanoes lie in the island chain southwest of the peninsula, but adjacent to parts of the 1952 rupture surface.
Krasheninnikov is one of about 25 active volcanoes running parallel to the Kuril trench. And so, if its timing suggests it was triggered by the earthquake, why this particular volcano and not another?
We calculate that the shaking at the volcano was about 0.2 g, which would have been strong enough to damage nearby buildings, whereas in the USGS model, it is a modest 0.06 g (Figure 9). But, there are a dozen volcanoes that were shaken twice as hard in our model. So, although shaking, or the dynamic stress changes imparted by the mainshock, could have released gasses in the magma conduits and begun a process that ultimately led to an eruption several days later, we don’t know why this did not occur at volcanoes closer to the rupture. If there were other signs of unrest at Krasheninnikov before the magnitude 8.8 shock that would indicate a greater sensitivity to shaking, we are not aware of them.
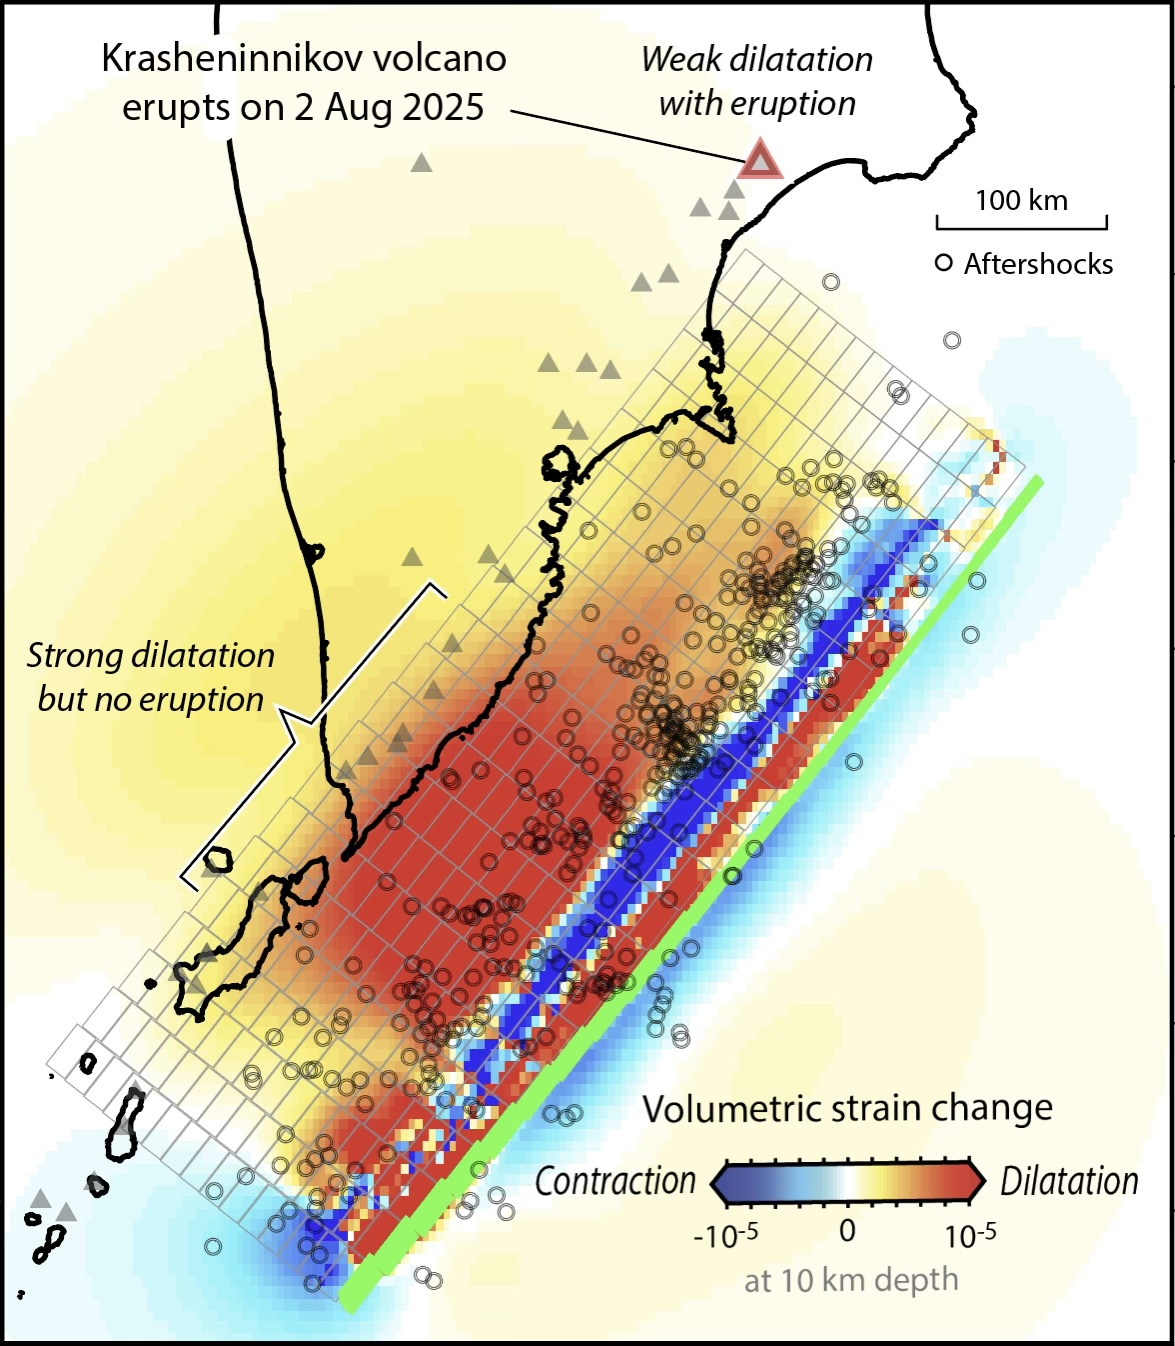
Another possible explanation is the decompression (dilatation) of the magma chamber or conduits imparted by the earthquake (Figure 12), which could also cause gasses to be released, an explanation advanced by Walter and Amelung (2007) to explain numerous cases of eruptions after megathrust events. However, in our model, Krasheninnikov undergoes only a modest dilatation of about one part per million. In contrast, there are between 8 and 10 volcanoes that received a calculated 40 parts per million. Therefore, we can all but eliminate this explanation.
What have we learned?
We argue that the foreshock sequence brought the epicentral patch successively closer to failure. We also find that the 10-day magnitude 7.4 foreshock produced an extremely high rate of aftershocks, as did the 2-day foreshock to the 2011 magnitude 9.0 Tohoku shock. If we are ever to predict earthquakes, we must identify unique or distinguishing elements of foreshocks or their aftershocks. Could aftershock productivity be an element of such a measure? Perhaps.
There are so few well-recorded cases of a complete earthquake cycle that the Kamchatka earthquake may hold clues to the earthquake preparation phase that we have yet to grasp. If it is a complete cycle, perhaps most disappointing is that the seismicity rate has been steady in the past 30 years, without giving away any clues about an impending megathrust quake.
Finally, the lack of publicly available local tsunami and strong motion records prevent us from a better understanding of both the tsunami and shaking. More data collection on the Kamchatka peninsula would permit a much better understanding of this enormous earthquake and its repercussions.
Science Editor: Dr. Alka Tripathy-Lang, Ph.D.
Reviewer: Dr. Kelian Dascher-Cousineau, Ph.D.
References
Bradley, K., Hubbard, J. ( 2025). A first look at the Mw8.8 Kamchatka earthquake. Earthquake Insights, https://doi.org/10.62481/f8aeb017
Dascher-Cousineau, K., Brodsky, E. E., Lay, T., and Goebel, T. (2020). What controls variations in aftershock productivity? J. Geophys. Res., 125, e2019JB018111. https://doi.org/10.1029/2019JB018111
DeMets, C., Gordon, R. G., and Argus, D. F. (2010) Geologically current plate motions. Geophys. J. Int. 181, 1–80.
Hubbard, J. and Bradley, K. (2025), M8.8 earthquake strikes offshore Kamchatka. Earthquake Insights, https://doi.org/10.62481/40091015
Lin, J., and R. S. Stein (2004), Stress triggering in thrust and subduction earthquakes and stress interaction between the southern San Andreas and nearby thrust and strike-slip faults, J. Geophys. Res., 109, B02303, doi:10.1029/2003JB002607.
Liu, C., Lay, T., Brodsky, E. E., Dascher‐Cousineau, K., and Xiong, X. (2019), Coseismic rupture process of the large 2019 Ridgecrest earthquakes from joint inversion of geodetic and seismological observations. Geophys. Res. Letts., 46, https://doi.org/10.1029/2019GL084949
Lotto, G.C., Nava, G. and Dunham, E.M. (2017), Should tsunami simulations include a nonzero initial horizontal velocity?. Earth Planets Space 69, 117, https://doi.org/10.1186/s40623-017-0701-8
MacInnes, B. T., Weiss, R., Bourgeois, J. & Pinegina, T. K. Slip distribution of the 1952 Kamchatka great earthquake based on near-field tsunami deposits and historical records. Bull. Seismol. Soc. Am. 100, 1695–1709 (2010).
Marsan, D., and B. Enescu (2012), Modeling the foreshock sequence prior to the 2011, MW9.0 Tohoku, Japan, earthquake, J. Geophys. Res., 117, B06316, doi:10.1029/2011JB009039.
Okal, E.A. Seismic parameters controlling far-field tsunami amplitudes: A review. Nat Hazards 1, 67–96 (1988). https://doi.org/10.1007/BF00168222
Schellart, W. P., Stegman, D. R., Farrington, R. J., & Moresi, L. (2011). Influence of lateral slab edge distance on plate velocity, trench velocity, and subduction partitioning. Journal of Geophysical Research, 116(B10). https://doi.org/https://doi.org/10.1029/2011JB008535
Toda, S., and R. S. Stein (2022). Central shutdown and surrounding activation of aftershocks from megathrust earthquake stress transfer, Nature Geoscience 15, 494–500, doi: 10.1038/s41561-022-00954-x.
Toda, Shinji, Stein, R.S., Sevilgen, Volkan, and Lin, Jian, 2011, Coulomb 3.3 Graphic-rich deformation and stress-change software for earthquake, tectonic, and volcano research and teaching—user guide: U.S. Geological Survey Open-File Report 2011–1060, 63 p., available at https://temblor.net/coulomb/
USGS, 2025. Event Page for 2025 M 8.8 Kamchatka, Russia, earthquake, https://earthquake.usgs.gov/earthquakes/eventpage/us6000qw60/executive
USGS, 2010. Event Page for 2010 M 8.8 Maule, Chile, earthquake, https://earthquake.usgs.gov/earthquakes/eventpage/official20100227063411530_30/executive
Walter, Thomas R., and Amelung, Falk (2007), Volcanic eruptions following M ≥ 9 megathrust earthquakes: Implications for the Sumatra-Andaman volcanoes. Geology, 35, 539–542. doi: https://doi.org/10.1130/G23429A.1
Copyright
Text © 2025 Temblor. CC BY-NC-ND 4.0
We publish our work — articles and maps made by Temblor — under a Creative Commons Attribution-NonCommercial-NoDerivatives 4.0 International (CC BY-NC-ND 4.0) license.
For more information, please see our Republishing Guidelines or reach out to news@temblor.net with any questions.