


Preliminary data indicate that the fault that ruptured in the Samos earthquake slipped 6 feet (1.8 meters).
By Athanassios Ganas, National Observatory of Athens, Institute of Geodynamics
Panagiotis Elias, National Observatory of Athens, Institute of Astronomy, Astrophysics, Space Applications and Remote Sensing
Pierre Briole, École Normale Supérieure de Paris, PSL Research University, Laboratoire de Géologie
Varvara Tsironi, National Observatory of Athens, Institute of Geodynamics; Department of Geology, University of Patras
Sotiris Valkaniotis, Koronidos Str., Greece
Javier Escartin, École Normale Supérieure de Paris, PSL Research University, Laboratoire de Géologie
Ilektra Karasante, National Observatory of Athens, Institute of Geodynamics
Eirini Efstathiou, National Observatory of Athens, Institute of Geodynamics
Citation: Ganas, A., Elias, P., Briole, P., Tsironi, V., Valkaniotis, S., Escartin, J., Karasante, I., and Efstathiou, E., 2020, Fault responsible for Samos earthquake identified, Temblor, http://doi.org/10.32858/temblor.134
Editor’s note: The summary is written for a public audience. Those interested in technical details should read the full article.
Summary
On October 30, 2020 11:51 UTC, a strong shallow earthquake rocked the eastern Aegean Sea. The epicenter was located offshore of the Greek island of Samos, about 160 miles (260 kilometers) to the East of Athens. The earthquake was a magnitude-6.7 on the Richter Scale according to the National Observatory of Athens (NOA). The effects of the earthquake were devastating in Greece and Turkey. In Greece, two young children lost their lives from a wall collapse in the town of Vathy, eastern Samos. In Turkey, more than 100 people died from multiple building collapses in the city of Izmir about 40 miles (60 kilometers) to the north of the epicenter.
Here we present a first analysis of the geodetic data that were gathered and processed as of Nov. 4, 2020 15:00 UTC. Our preliminary modeling indicates that the rupture occurred on a 23-mile long (37 kilometer) north-dipping tensional (‘normal’) fault located off the northern shore of Samos.
InSAR is a form of imagery collected by repeating passes of a radar satellite over an area. The technique is used to measure how much the ground has moved roughly vertically between each pass of a satellite and can give scientists a clue as to how much slip occurred on a fault beneath the surface. In this case, the fault that ruptured in the Samos earthquake slipped 6 feet (1.8 meters). The upper edge of the fault rupture — the part of the fault that slipped closest to the surface, is at a shallow depth of 0.9 miles (1.5 kilometers) near the northern shore of Samos.
Introduction
The Samos area is located in eastern part of the Aegean (Eurasia) microplate, a well-known extensional, back-arc area behind the Hellenic subduction (McKenzie, 1978; Ganas and Parsons, 2009). The kinematics of the plate motions are determined by the subduction of the African oceanic plate under the Aegean and the westwards motion of the Anatolian microplate. Crustal extension is accommodated by a combination of normal-slip and strike-slip motions along active faults, especially in central Aegean and western Anatolia (Mascle and Martin, 1990; Taymaz et al. 1991; Tan et al. 2014). In terms of strain, the amount of crustal extension between Samos and western Anatolia (the broader Izmir area) is 7.4 mm/yr according to Vernant et al. (2014) based on GNSS data modeling.
The Mw=7.0 earthquake of Oct. 30, 2020 11:51 UTC occurred north of the island of Samos (Fig. 1), along a E-W striking normal fault as indicated by the moment tensor solutions of both regional and teleseismic data (compiled by EMSC). Through Nov. 2, 2020 more than 776 aftershocks (with 2.0≤ML≤5.2) were recorded by EMSC (Fig. 2). Three hours after the mainshock, a moderate-size Mw = 5.2 aftershock struck at 15:14 UTC. The moment tensor solutions of the mainshock indicate E-W to ESE-WNW normal faulting in agreement with the regional, extensional tectonics. The aftershock sequence extends over a distance of 70-km east-west with most of events occurring to the east of the mainshock (Fig. 2). The EMSC aftershock data (the longitude vs time plot; in days from main shock) show that the sequence is spatially constrained between 26.4°E – 27.2°E (Fig. 2 middle panel).


Sentinel-1 Interferogram
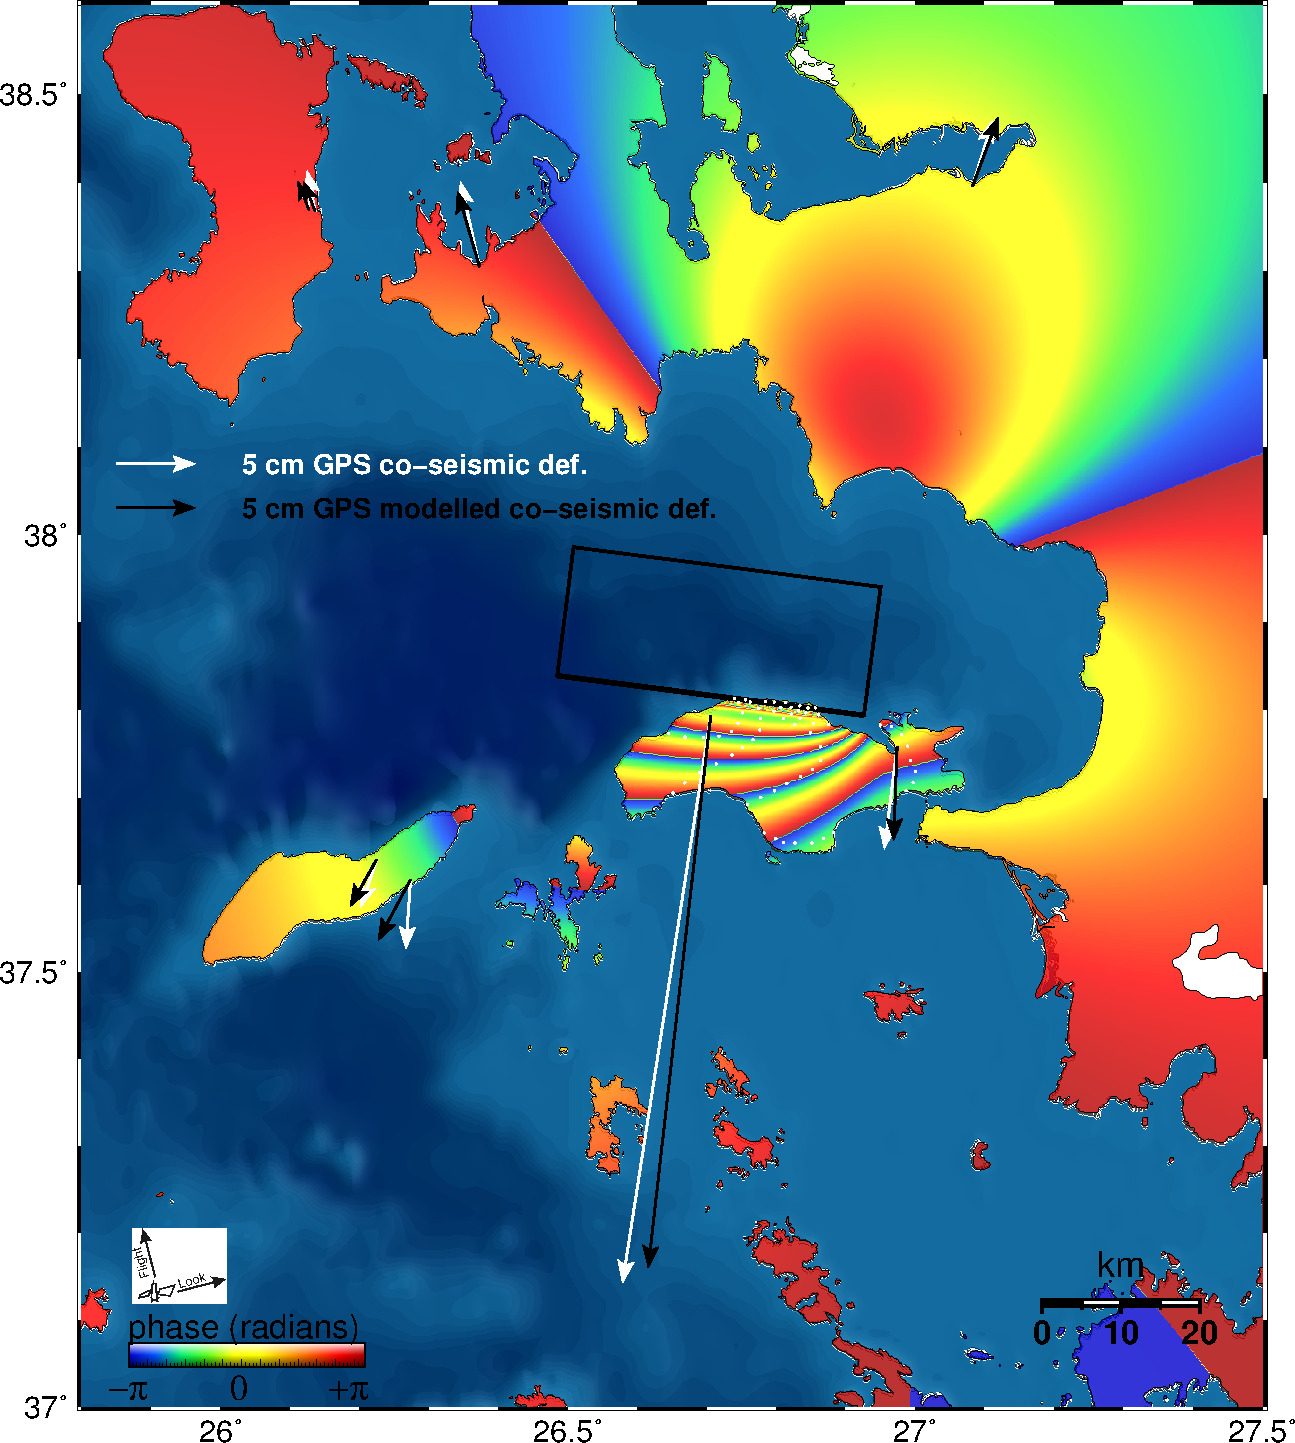
We used the ascending images acquired by the European satellites Sentinel-1 on October 24 and October 30, 2020 on the track 131. The interferogram (Fig. 3) was made on the Geohazards Exploitation Platform using the SNAP software. The digital elevation model (DEM) used for the processing is the Shuttle Radar Topography Mission (SRTM) 1 Arc-Second Global. We enhanced the signal to noise ratio by applying the adaptive power spectrum filter of Goldstein and Werner (1998) with a coherence threshold of 0.3. The quality of the interferogram is good, both in terms of coherence and tropospheric noise. The interferogram shows fringes corresponding to ground deformation onshore Samos. The absolute value of the interferometric fringes is estimated by the tie to the GNSS stations SAMO and SAMU (Fig. 1) that captured the co-seismic displacement. All fringes correspond to motion towards the satellite except the short northern one located by the coast where the motion is away from the satellite. We extracted the line of sight (l.o.s) displacements by picking the six fringes on Fig. 3 at 64 locations in total. The uplift is interpreted a result of co-seismic motion along an offshore normal fault, running E-W and dipping to the North.

Co-seismic motion of the GNSS stations
We analyzed the data of eleven GNSS stations belonging to two Greek private networks, SmartNet and Uranus, and from the Turkish network CORS (Fig. 1). The processing was made using two different Precise Point Positioning (PPP) software: the GIPSY/OASIS II software (ver. 6.4) developed by the Jet Propulsion Laboratory (JPL), and the Canadian online processing PPP service. The coseismic displacements are listed in Tab. 1, and Fig. 4 shows the time series at SAMO (Karlovasi). We could not see in the GNSS data evidence for any rapid post-seismic deformation, and in particular there is no offset at the time of the large aftershock on Oct. 30, 2020 15:14 UTC (M=5.2). Consequently, because the second Sentinel-1 image was acquired in the afternoon of Oct. 30, shortly after the event, we assume that the interferogram (Fig. 2) contains coseismic signal only with insignificant post-seismic fault slip.

Fault model
We use the InSAR l.o.s. displacements and the GNSS offsets to estimate the fault parameters assuming a rectangular source buried in a homogeneous elastic half-space and homogeneous slip. Our inversion approach finds the geometry and kinematics (strike and dip-angle) of best-fitting fault model. We invert jointly the l.o.s InSAR ground motions and the GNSS co-seismic displacements using the code inverse6 (Briole, 2017). The modelling allows us to constrain seven parameters: the 3D location of the fault-top center, the fault azimuth, length and width and the amount of slip. We assume pure normal faulting and do not invert for a component of rake, as this parameter is coupled with the fault azimuth in the inversion of geodetic data. We also fix the fault dip-angle of 37° given by the seismological moment tensors, as the geodetic data does not have the capacity to resolve this angle. The fault width is also only loosely constrained because there are no GNSS points in the near field on the Turkish shore in front of Samos. Our best fitting model is with a fault of 36 km length and 18 km width, striking N276°E, (Fig. 5).
Analyzing the solution space, we find that all lengths between 32 and 42 km are possible, all widths between 14 and 19 km, and all slips between 1.5 and 2.2 m, with the product of the three being constant (to comply with the derived geodetic moment). The possible range of depths of the base of the fault slip is 10 to 13 km, thus slightly deeper that the 10 km found for the Mw = 6.6 July 2017 Kos-Bodrum earthquake (Ganas et al. 2019). We also verified the impossibility of the south dipping fault model, as such model cannot jointly fit the GNSS vectors and the InSAR fringes.
Acknowledgements: We thank Brendan Crowell, Simon Bufféral, Nicolas Chamot-Rooke, Marco Meschis, Tuncay Taymaz, Diego Melgar, Evi Nomikou, Margarita Segou and Efthimios Lekkas for comments and discussions. We are indebted to ESA, Geohazards Lab and Terradue for providing access to Geohazards Exploitation Platform (GEP) for InSAR cloud processing. GNSS data were provided by Hexagon SmartNET and Uranus (Tree) networks of Greece. We thank Tuncay Taymaz and Semi Ergintav for sharing Turkish GNSS data.
References
Briole, P. 2017. Modelling of earthquake slip by inversion of GNSS and InSAR data assuming homogenous elastic medium. Zenodo, http://doi.org/10.5281/zenodo.1098399
Ganas, A., Parsons, T., 2009. Three‐dimensional model of Hellenic Arc deformation and origin of the Cretan uplift. J. Geophys. Res.: Solid Earth 114 (B6) https://doi.org/10.1029/2008JB005599 .
Ganas, A., et al, 2019. The July 20, 2017 M6.6 Kos Earthquake: Seismic and Geodetic Evidence for an Active North-Dipping Normal Fault at the Western End of the Gulf of Gökova (SE Aegean Sea), Pure and Applied Geophysics, 176 (10), 4177-4211 https://doi.org/10.1007/s00024-019-02154-y
Goldstein, R. M.; Werner, C. L. 1998. Radar interferogram filtering for geophysical applications. Geophys. Res. Lett. 25(21), 4035-4038
Mascle, J., and L. Martin, 1990. Shallow structure and recent evolution of the Aegean Sea: A synthesis based on continuous reflection profiles, Marine Geology, 94, 4, 271-299.
McClusky, S., et al. 2000, Global Positioning System constraints on plate kinematics and dynamics in the eastern Mediterranean and Caucasus, J. Geophys. Res. 105, B3, 5695-5719, DOI: 10.1029/1999JB900351.
McKenzie, D. 1978. Active tectonics of the Alpine–Himalayan belt: the Aegean Sea and surrounding regions, Geophys. J. Roy. Astr. Soc. 55, 1, 217-254, DOI: 10.1111/j.1365-246X.1978.tb04759.x.
Tan, O., Papadimitriou, E.E., Pabucçu, Z. et al. 2014. A detailed analysis of microseismicity in Samos and Kusadasi (Eastern Aegean Sea) areas. Acta Geophys. 62, 1283–1309. https://doi.org/10.2478/s11600-013-0194-1
Taymaz, T., J. Jackson, and D. McKenzie 1991. Active tectonics of the north and central Aegean Sea, Geophys. J. Int. 106, 2, 433-490, DOI: 10.1111/j.1365-246X.1991.tb03906.x
Vernant, P.; R. Reilinger, S. McClusky, 2014. Geodetic evidence for low coupling on the Hellenic subduction plate interface, Earth and Planetary Science Letters, 385, 122-129, https://doi.org/10.1016/j.epsl.2013.10.018 .
The SAR images acquired by the SENTINEL-1 satellites are distributed routinely by the European Space Agency (ESA) free of charge. The GNSS data from stations surrounding the epicenter were provided by the Greek private GNSS networks (SmartNet and Uranus) and the Turkish CORS network.