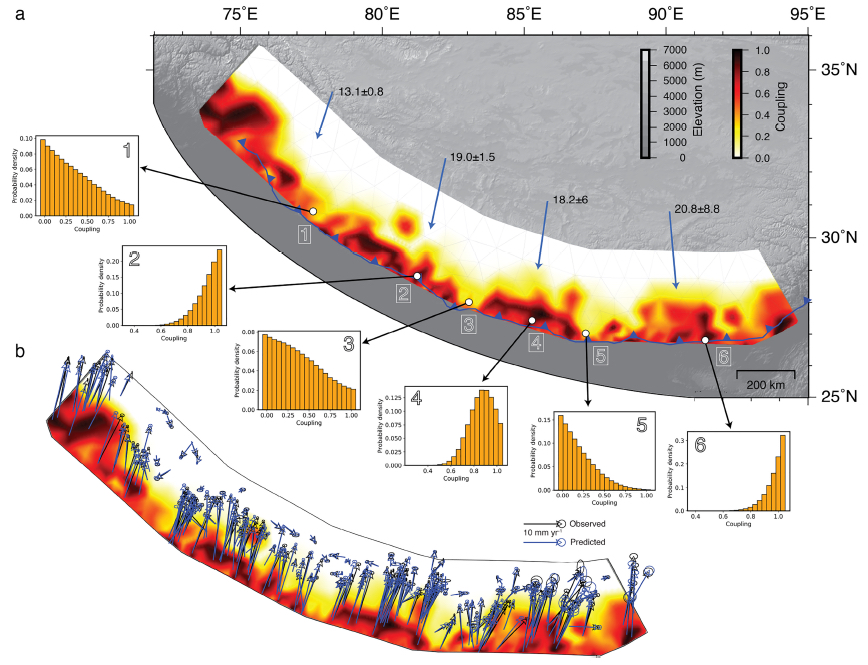
(a) Overlain atop a digital elevation model of the topography of the Himalaya is the map of coupling, or degree of locking, produced by Dal Zilio et al. The degree to which the range is locked ranges from 0, which means the fault is moving at a rate equal to convergence (see blue arrows that show rates between 13 to 20 millimeters per year), to 1, which means the fault is completely stuck. Anything between 0 and 1 means that the fault partially locked. Locations 1, 3 and 5 show where the fault is inferred to slowly slip. These regions function as seismic barriers for many earthquakes. Locations 2, 4 and 6 show examples of where the fault is locked. (b) This is the same map of coupling, or locking, as above, but it shows the measured GPS motion in blue, along with black arrows that are drawn from Dal Zilio’s model. The model predictions generally overlie the GPS observations. Credit: Dal Zilio et al., 2020
- Living through the Loma Prieta earthquake - October 21, 2021
- The Great Quake Debate: an interview with seismologist and author Susan Hough - August 27, 2020
- Salton Sea Swarm quiets down - August 12, 2020