By David Jacobson, Temblor
Click here to protect yourself from natural disasters

Last October, the Tubbs Fire ripped across Northern California, burning parts of Napa, Sonoma, and Lake counties. By the time it was put out, it had destroyed over 5,600 structures, killed 43 people, and burned over 36,000 acres. Because of the number of structures claimed, it is the most destructive fire in the state’s history. While the exact cause of the fire remains under investigation, there were reports of both downed power lines, and exploding transformers in the area around which the fire began. Couple this with strong northeasterly winds and the ensuing fire moved extremely rapidly.
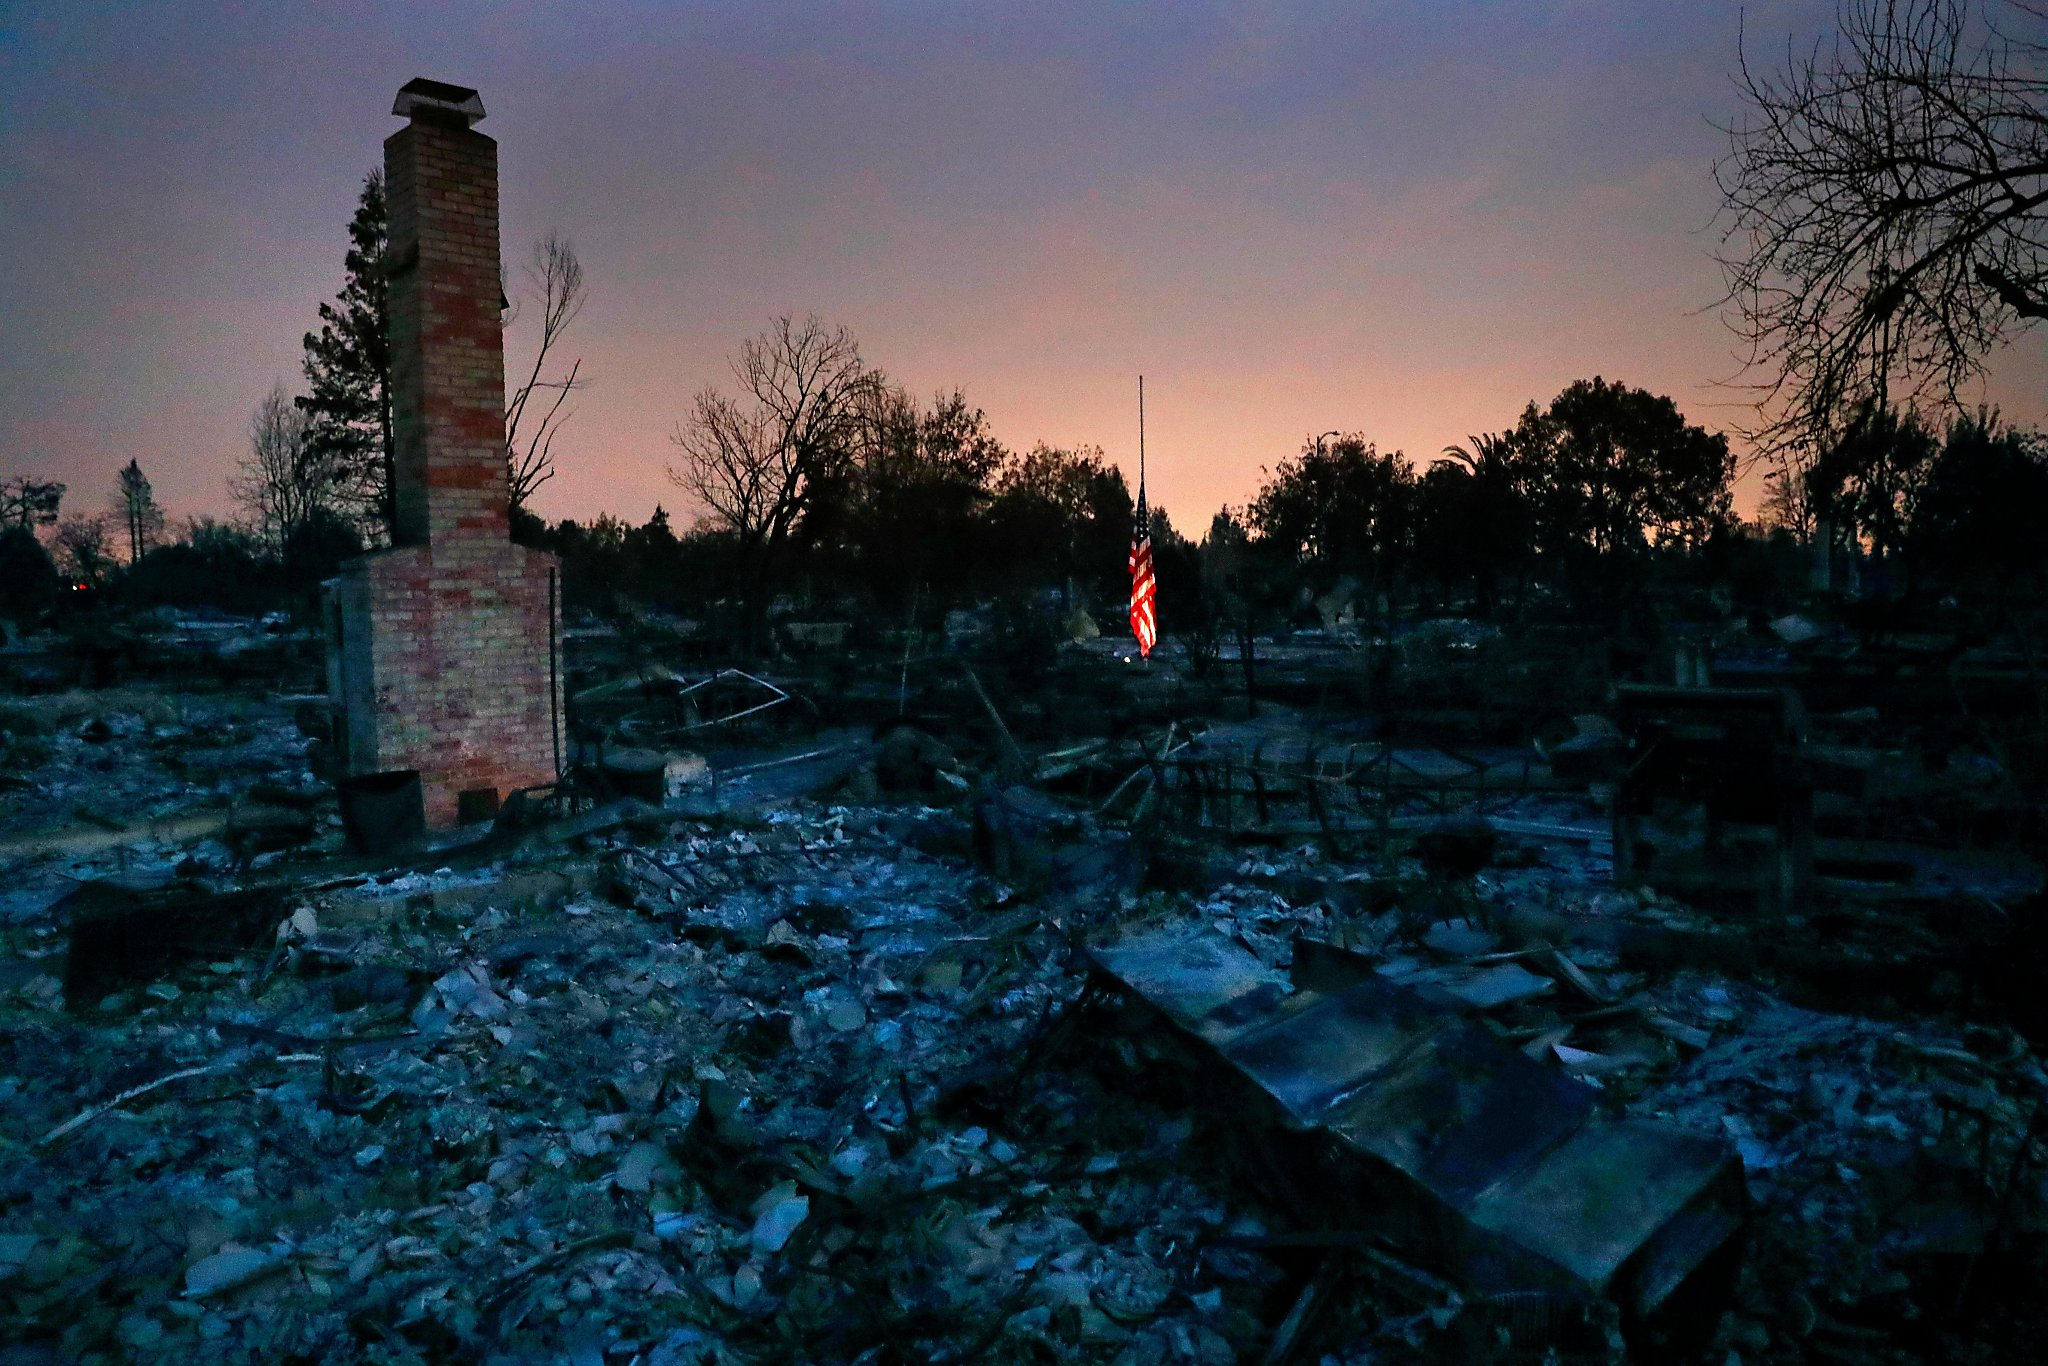
Even though the fire has long been put out, residents of the region still have a long way to go to recover, as was reported by the Los Angeles Times last week. Additionally, because many regions in California have a high fire threat, residents should be aware if they live in an area at risk of wildfires or if they are close to what is known as the Wildland-Urban Interface (WUI), which are areas where homes are built near or among lands prone to wildland fire. Such zones are important to recognize, because given the right conditions, wildfires can spread through urban zones, as was seen in the Tubbs Fire, especially around Coffey Park.

In the maps below, from the West Wide Wildfire Risk Assessment, the area around the Tubbs Fire is shown. The maps not only illustrate the fire threat, but the suppression difficulty, and how bad effects would be. What must be said about these maps is that they only consider areas that are prone to wildfires, which means urban areas are excluded. However, as was previously mentioned, wildfires can spread into urban areas with proper conditions.
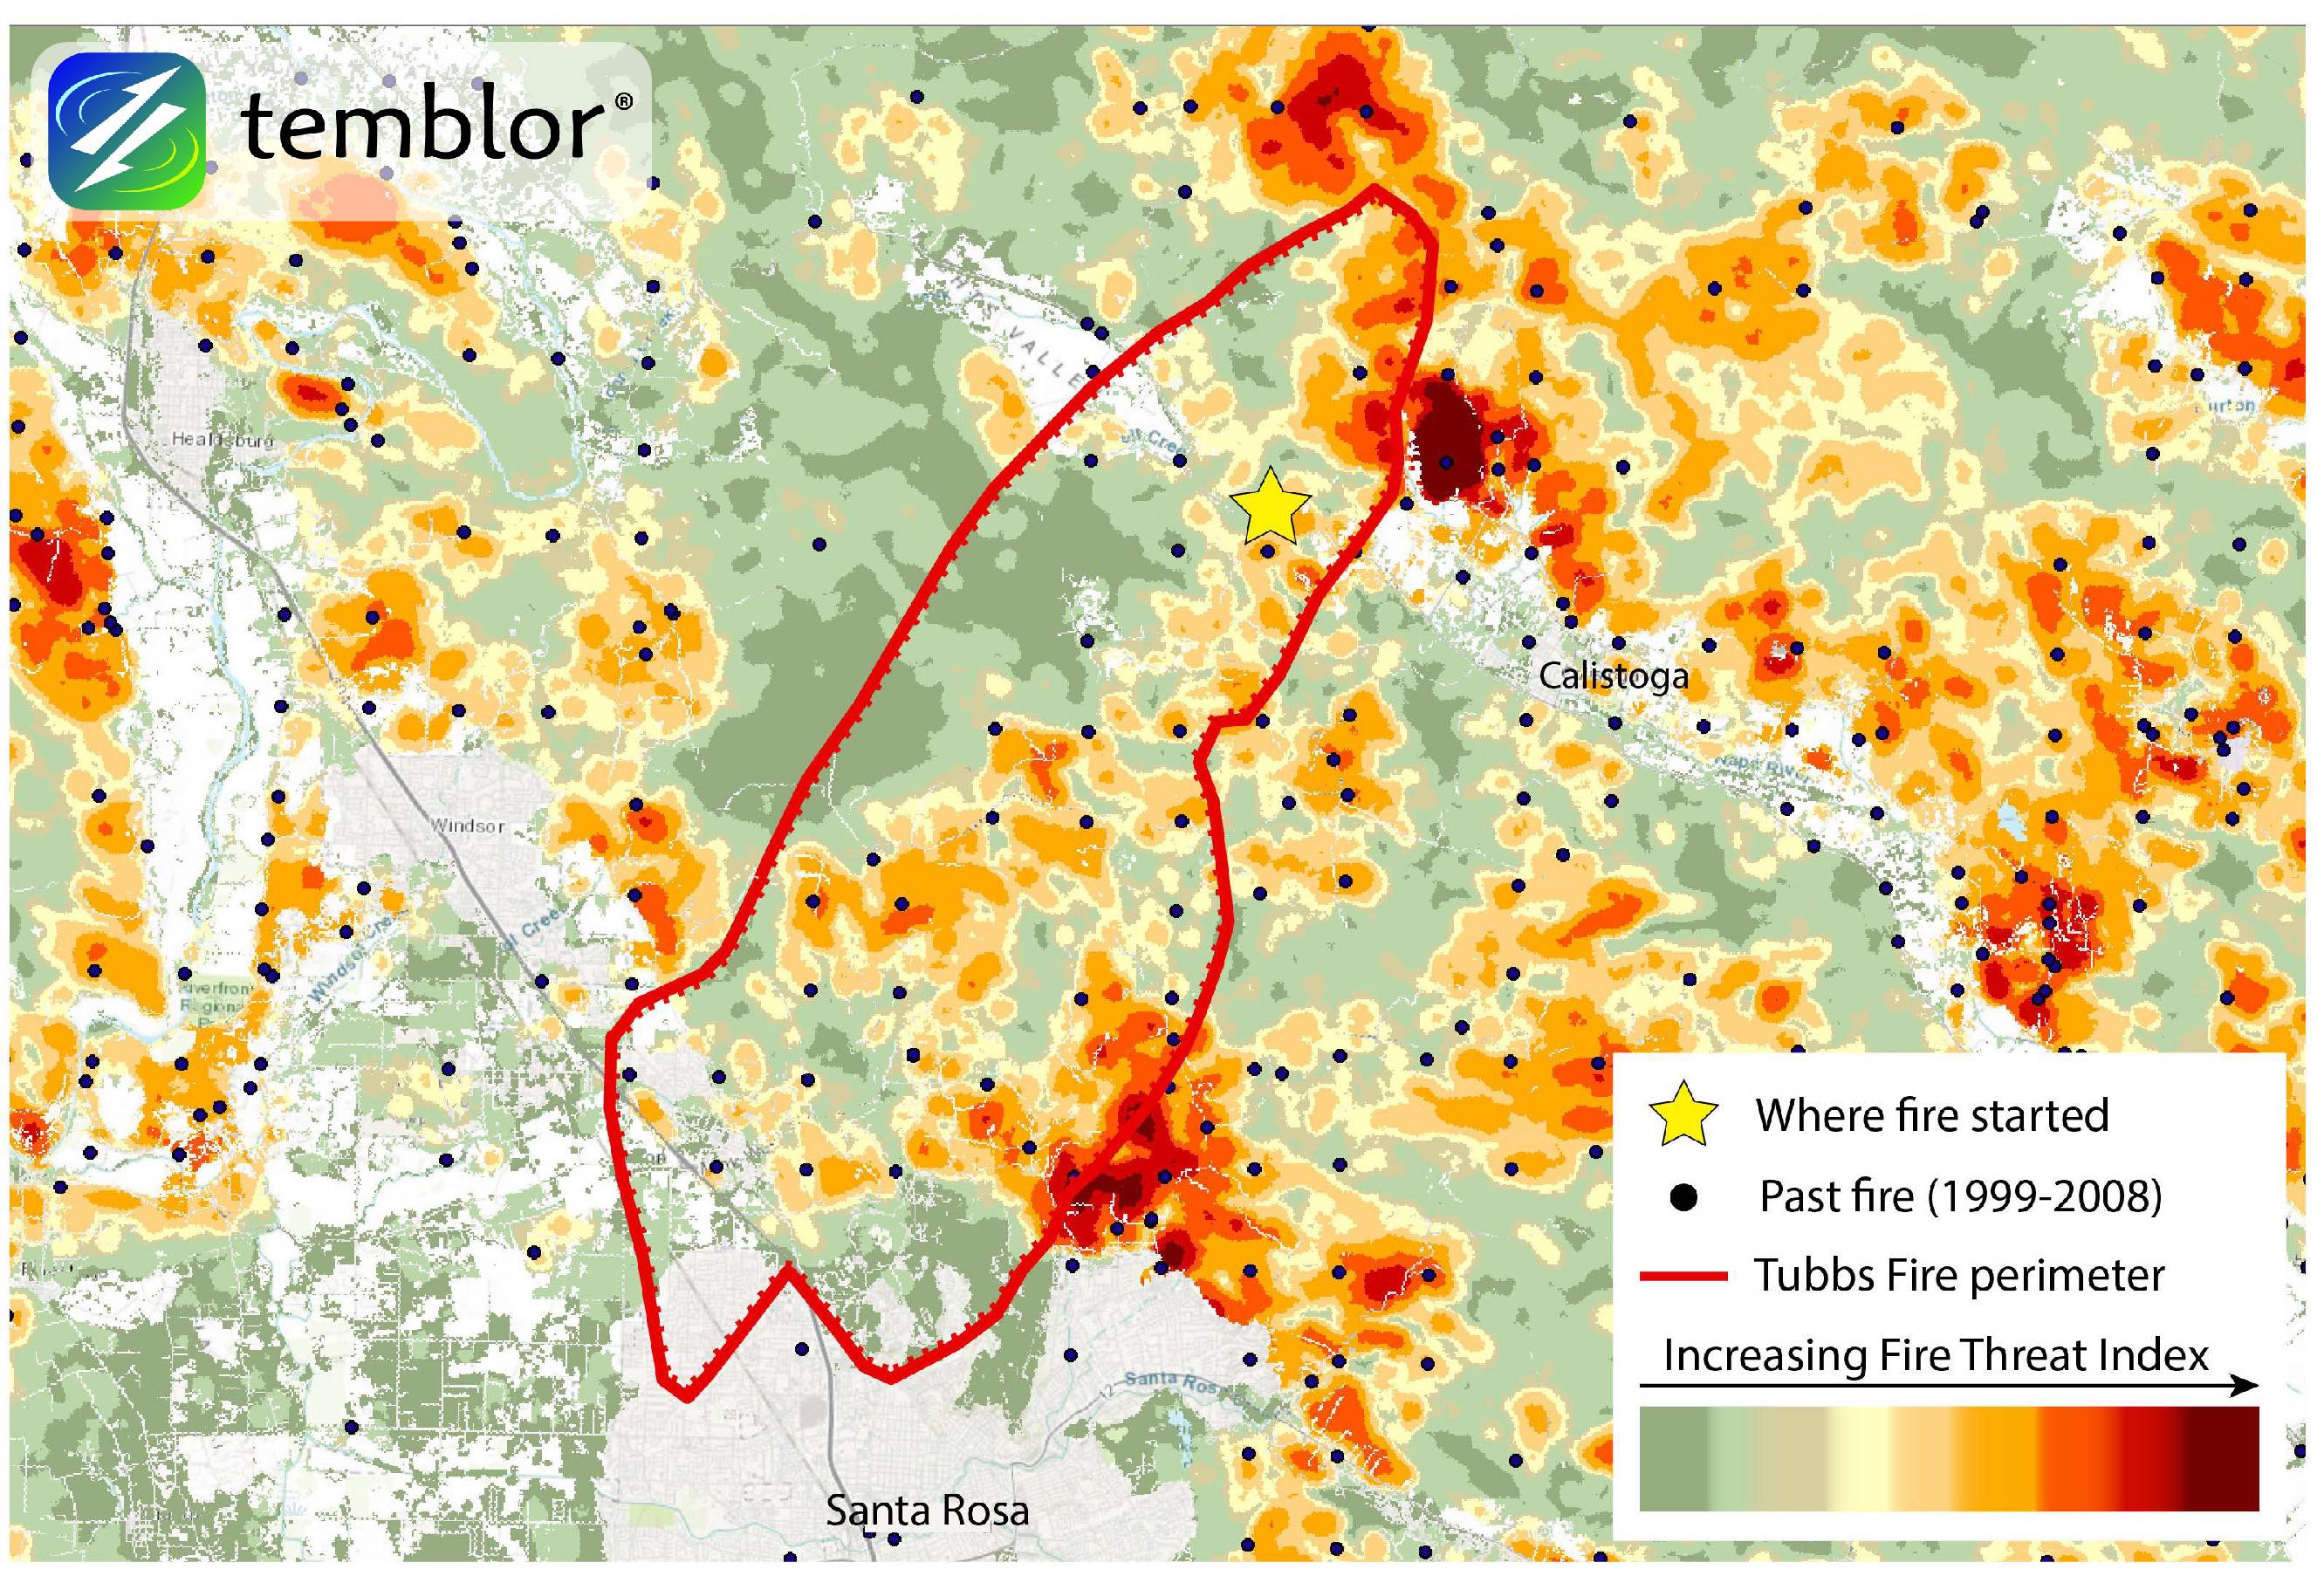
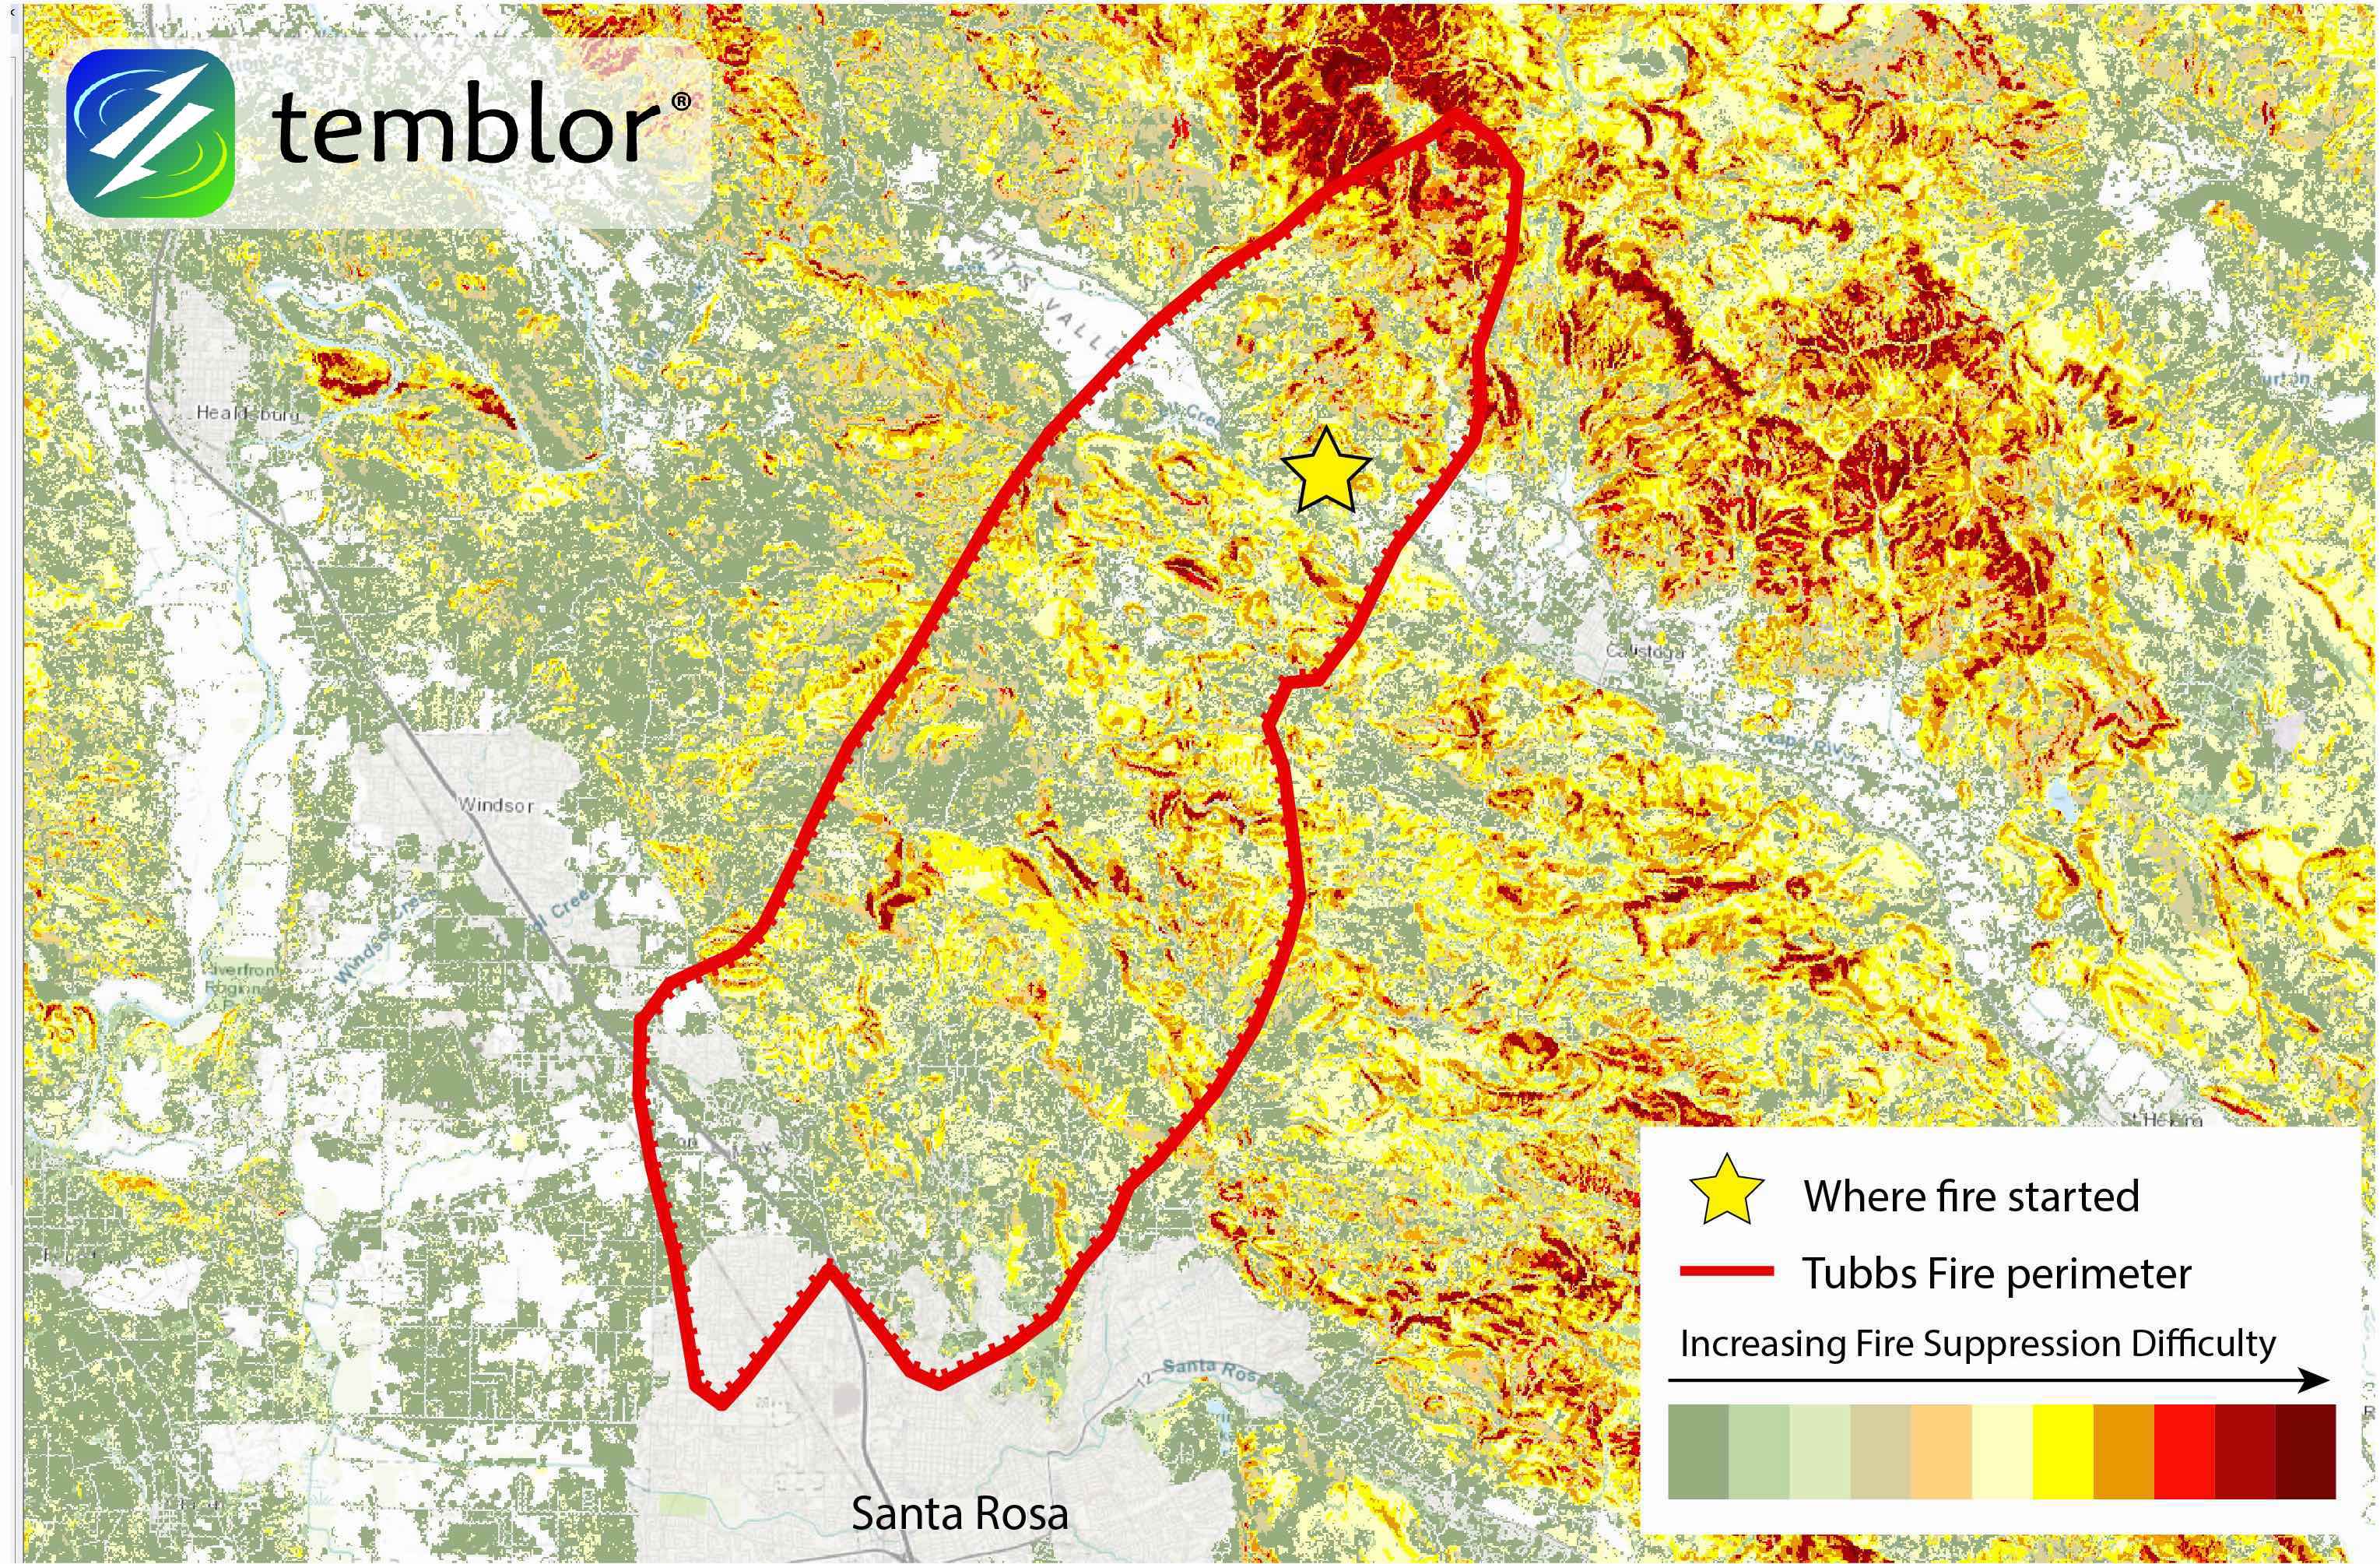

These maps highlight several things. First, wildfires do not always start in areas where the threat is high. While there are areas that are more susceptible, one small ignition can turn into a raging inferno given the right situation, including slope and weather conditions. Additionally, and perhaps most importantly, just because you are not in a wildfire zone does not mean you won’t be impacted by a wildfire. In all of the maps, the approximate perimeter of the Tubbs Fire is shown. What can be seen is that several urban areas burned, which is where a large portion of the losses were seen. Therefore, people should not only be aware if they live in an area susceptible to wildfire, but if they live close to the wildland-urban interface. By doing this, they can learn their risk, and take measures to reduce it.
References
West Wide Wildfire Risk Assessment
LA Times
SF Chronicle
Cal Fire
-
ډیری عوامل افغاني ټولنې د زلزلې پر وړاندې زیانمنوي
- August 11, 2022 - What’s happening this week in Humboldt County, California: The squeeze - February 6, 2019
- Finding of the unexpected tsunami due to the strike-slip fault at central Sulawesi, Indonesia on 28 September 2018, from the preliminary field survey at Palu - October 15, 2018