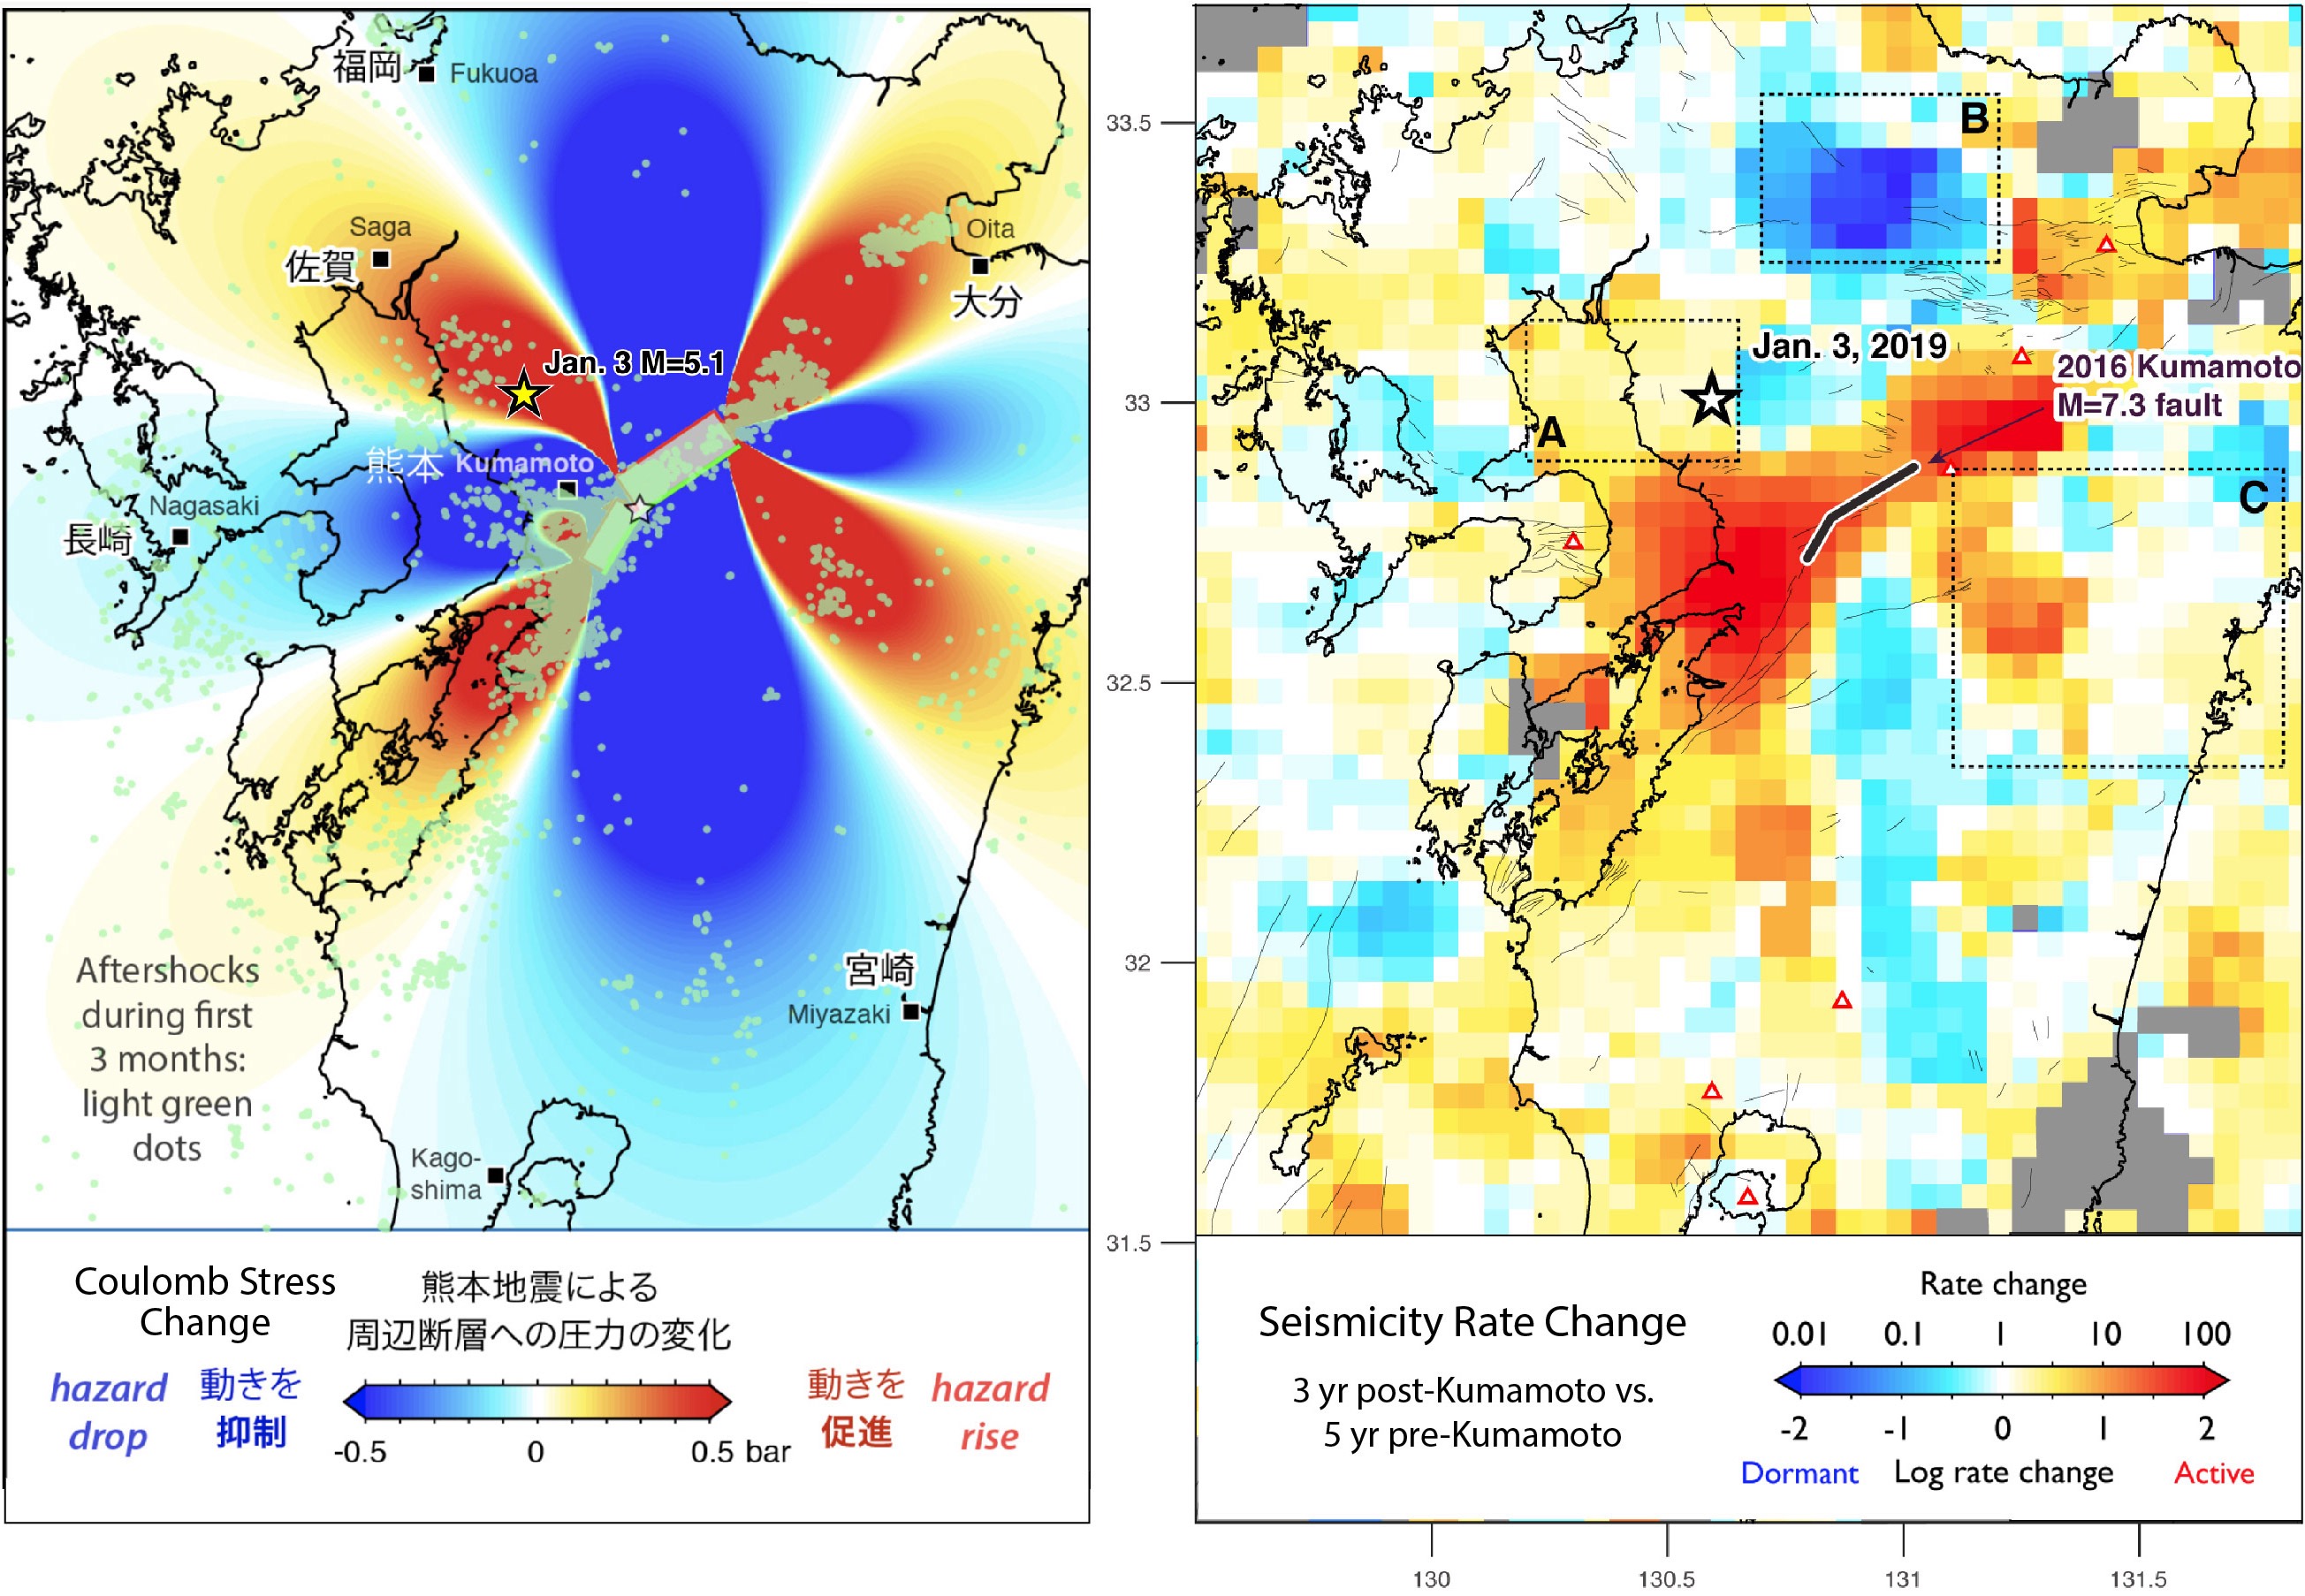
Figure 2. (Left panel) Coulomb stress imparted by the 2016 Kumamoto earthquake sequence to the surrounding crust as a result of the combined Mw=6.0 and Mw=7.0 shocks. This figure was originally posted in a Temblor blog (Stein and Toda, 2016). Regions in which strike-slip faults are brought closer to failure are red (‘stress trigger zones’); regions now inhibited from failure are blue (‘stress shadows’). Aftershocks during first three months (translucent green dots) generally lie in regions brought closer to failure. The January 3 event (yellow star) is located in one of the stress trigger zones. (Right panel) Seismicity rate change between before (2009/01/01-2016/04/14) and after (2016/04/14-2019/01/02) the 2016 Kumamoto earthquake sequence. Red areas ‘turned on’ after the 2016 mainshock; blue areas ‘shut down.’
-
ډیری عوامل افغاني ټولنې د زلزلې پر وړاندې زیانمنوي
- August 11, 2022 - What’s happening this week in Humboldt County, California: The squeeze - February 6, 2019
- Finding of the unexpected tsunami due to the strike-slip fault at central Sulawesi, Indonesia on 28 September 2018, from the preliminary field survey at Palu - October 15, 2018